Information on running packet captures and debugging commands to follow traffic flows.
Table Of Contents
Management interface packet capture
As management traffic is not on the dataplane tcpdump has to be used to capture packets that traverse the management interface. Unlike dataplane captures there is no GUI for tcpdump, it all has to be done from the CLI.
- Each platform has a default number of bytes that tcpdump captures from each packet (PA-220 68 bytes, PA-7000 & VM-Series 96 bytes), anything over that is truncated
- The snap length (snaplen) can be used to change the number of packets that tcpdump will capture (0-65535). 0 will cause the firewall to use the maximum length required to capture whole packets
- The capture is saved to a file named mgmt.pcap that is overwritten each time tcpdump is run
tcpdump filter "<filter-option>" [snaplen <length>]
The headers of the capture can be viewed in the console (add follow yes for realtime) or the capture copied off to be viewed in wireshark.
view-pcap mgmt-pcap mgmt.pcap
view-pcap follow yes mgmt-pcap mgmt.pcap
scp export mgmt-pcap from mgmt.pcap to <username@host:path>
An example using tcpdump to capture my SSH session, view it on the console and also export it off the firewall.
ste@HME-PAL-OEW1> tcpdump filter "host 10.10.64.202" snaplen 0
Press Ctrl-C to stop capturing

tcpdump: listening on eth0, link-type EN10MB (Ethernet), capture size 65535 bytes
^C3 packets captured
3 packets received by filter
0 packets dropped by kernel

ste@HME-PAL-OEW1> view-pcap mgmt-pcap mgmt.pcap
08:01:57.371795 IP hme-pal-oew01.stesworld.com.ssh > macoloco-wifi-grn.stesworld.com.50356: Flags [P.], seq 2897926068:2897926244, ack 1713596269, win 273, options [nop,nop,TS val 2779134928 ecr 1682771308], length 176
08:01:57.381087 IP macoloco-wifi-grn.stesworld.com.50356 > hme-pal-oew01.stesworld.com.ssh: Flags [.], ack 176, win 2045, options [nop,nop,TS val 1682771376 ecr 2779134928], length 0
08:02:04.156289 IP macoloco-wifi-grn.stesworld.com.50356 > hme-pal-oew01.stesworld.com.ssh: Flags [P.], seq 1:97, ack 176, win 2048, options [nop,nop,TS val 1682778150 ecr 2779134928], length 96

ste@HME-PAL-OEW1> scp export mgmt-pcap from mgmt.pcap to ste@10.10.64.202:mgmt.pcap
Password:
ste@HME-PAL-OEW1>
Dataplane packet capture
For non-management packet captures the packets are captured on the dataplane rather than on an interface. Packet captures are session-based which means a single filter is capable of capturing both client2server and server2client traffic. When filtering is enabled new sessions are marked capture, existing sessions will need to be restarted if they are to be marked and therefore captured.
Filtering
The first thing to do is setup the filters of what is to be captured. As filters are session-aware they only really need to be set for one direction (return packets will also be captured), however it is good practice to also include a returning traffic filter in case the packets do not match the session (the destination IP may be the NAT source of the outbound packet).
Can have in total 4 filters (indexes) attached to a capture matching in an OR logic with each capable of using any combination of the following options in an AND logic. A field not filled in will count as a wildcard for that filter value.
• ingress-interface • source • source-netmask (not needed for a /32 host) • source-port
• protocol • destination • destination-netmask (not needed for a /32 host) • destination-port
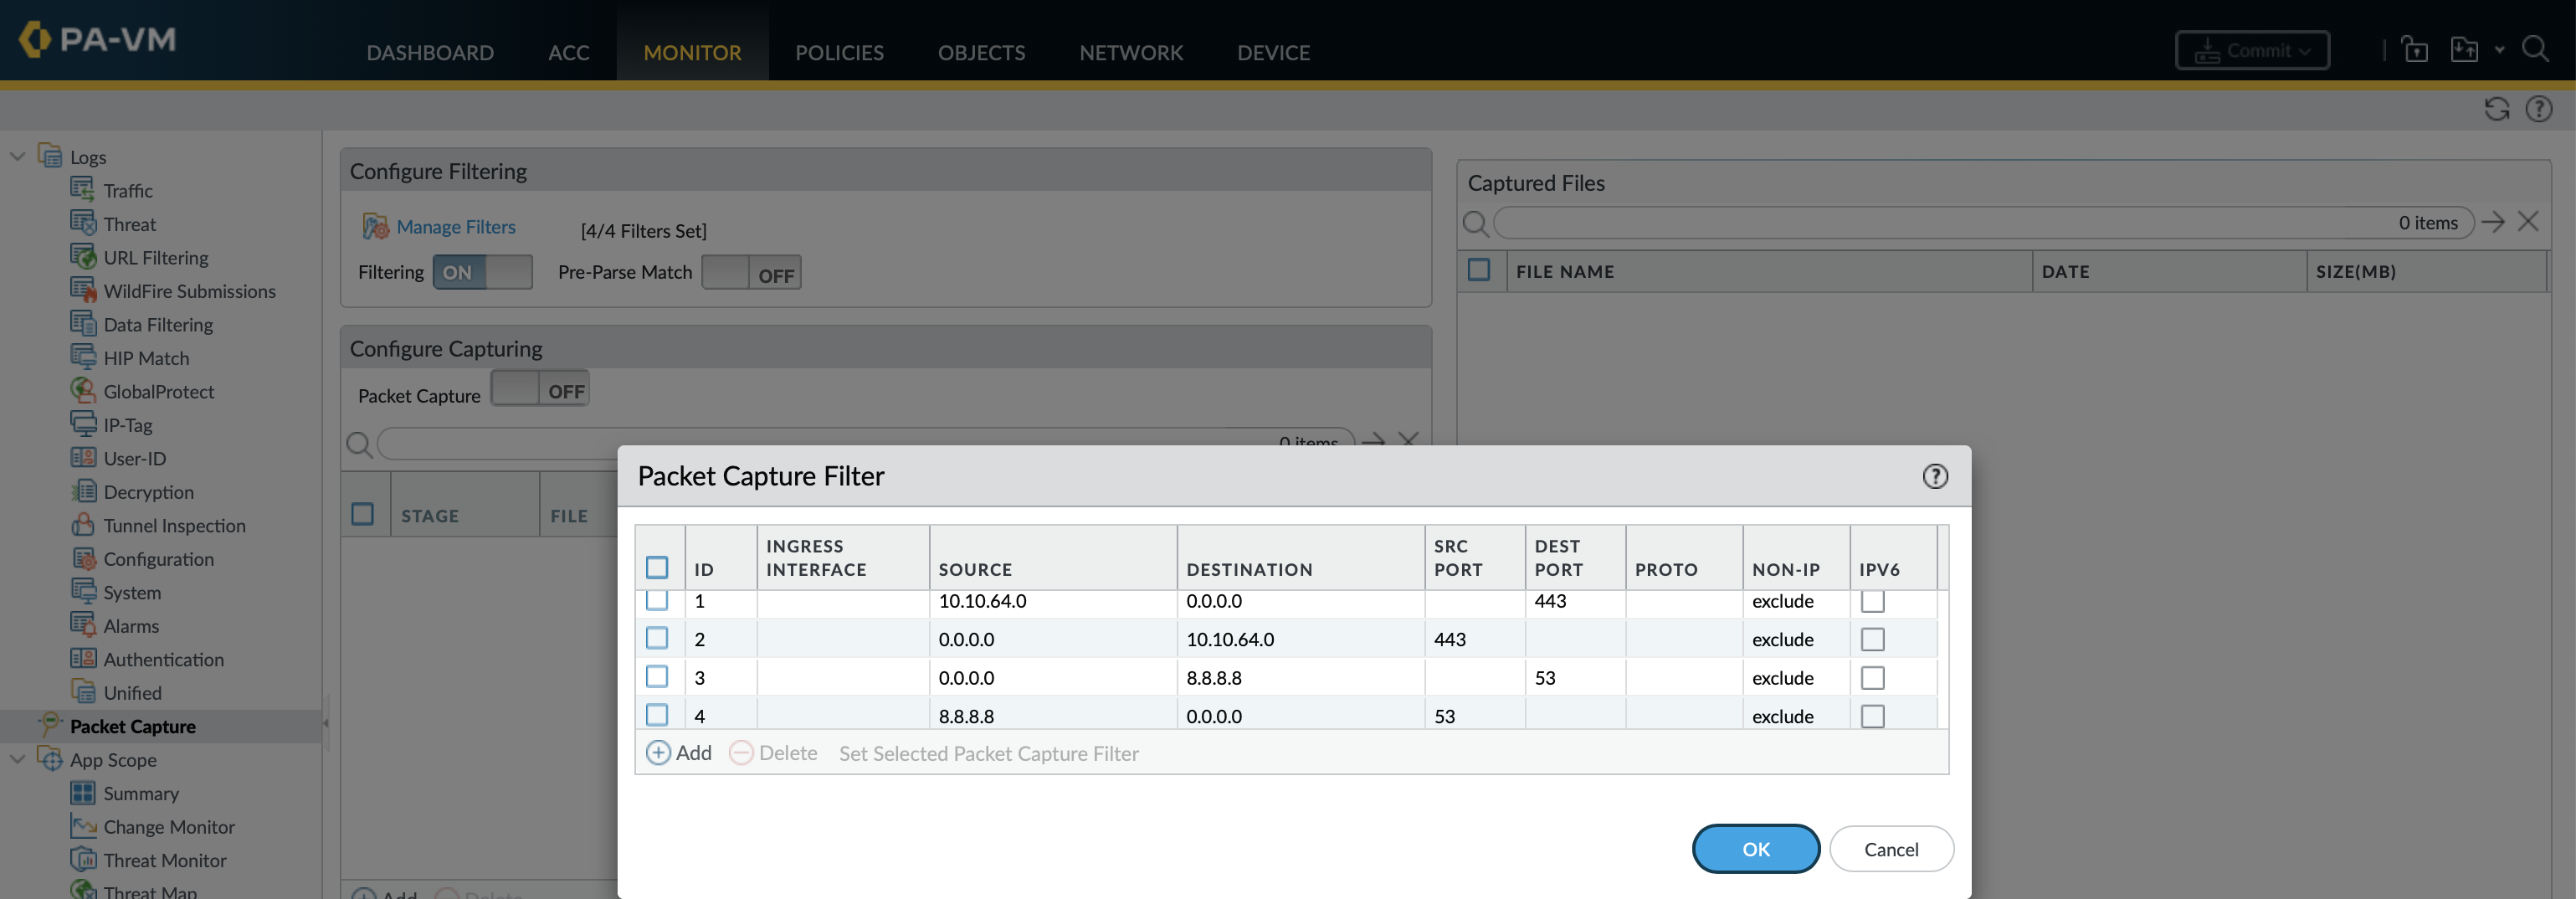
This filter is designed to capture all HTTPS traffic to and from 10.10.64.0/24 as well as all DNS traffic to google and the responses.
debug dataplane packet-diag set filter match source10.10.64.0 source-netmask24 destination-port443 debug dataplane packet-diag set filter match source-port443 destination10.10.64.0 destination-netmask24 debug dataplane packet-diag set filter match destination8.8.8.8 destination-port53 debug dataplane packet-diag set filter match source8.8.8.8 source-port53 debug dataplane packet-diag show settingTo check the settings debug dataplane packet-diag clear filter indexall Clear all filter indexes debug dataplane packet-diag clear filter index2 Clear a specific filter index (1 -4), in this case the second
ste@HME-PAL-OEW1> debug dataplane packet-diag show setting

--------------------------------------------------------------------------------
Packet diagnosis setting:
--------------------------------------------------------------------------------
Packet filter
  Enabled:                   yes
  Match pre-parsed packet:   no
  Filter offload:            yes
  Index 1: 10.10.64.0/24[0]->0.0.0.0/0[443], proto 0
           ingress-interface any, egress-interface any, exclude non-IP
  Index 2: 0.0.0.0/0[443]->10.10.64.0/24[0], proto 0
           ingress-interface any, egress-interface any, exclude non-IP
  Index 3: 0.0.0.0/0[0]->8.8.8.8/32[53], proto 0
           ingress-interface any, egress-interface any, exclude non-IP
  Index 4: 8.8.8.8/32[53]->0.0.0.0/0[0], proto 0
           ingress-interface any, egress-interface any, exclude non-IP
The filters can be tested against the global counters to see if they are matching any of the current traffic. Run the command a couple of times as the delta shows the difference in counter values between the last time the command was run.
ste@HME-PAL-OEW1> show counter global filter packet-filter yes delta yes

Global counters:
Elapsed time since last sampling: 8.275 seconds

name                                   value     rate severity  category  aspect    description
--------------------------------------------------------------------------------
pkt_sent                                   3        0 info      packet    pktproc   Packets transmitted
flow_ip_cksm_sw_validation                 8        0 info      flow      pktproc   Packets for which IP checksum validation was done in software
dfa_sw                                     1        0 info      dfa       pktproc   The total number of dfa match using software
ctd_pscan_sw                               1        0 info      ctd       pktproc   The total usage of software for pscan
ctd_pkt_slowpath                           1        0 info      ctd       pktproc   Packets processed by slowpath
--------------------------------------------------------------------------------
Total counters shown: 5
--------------------------------------------------------------------------------
Capture stage and size
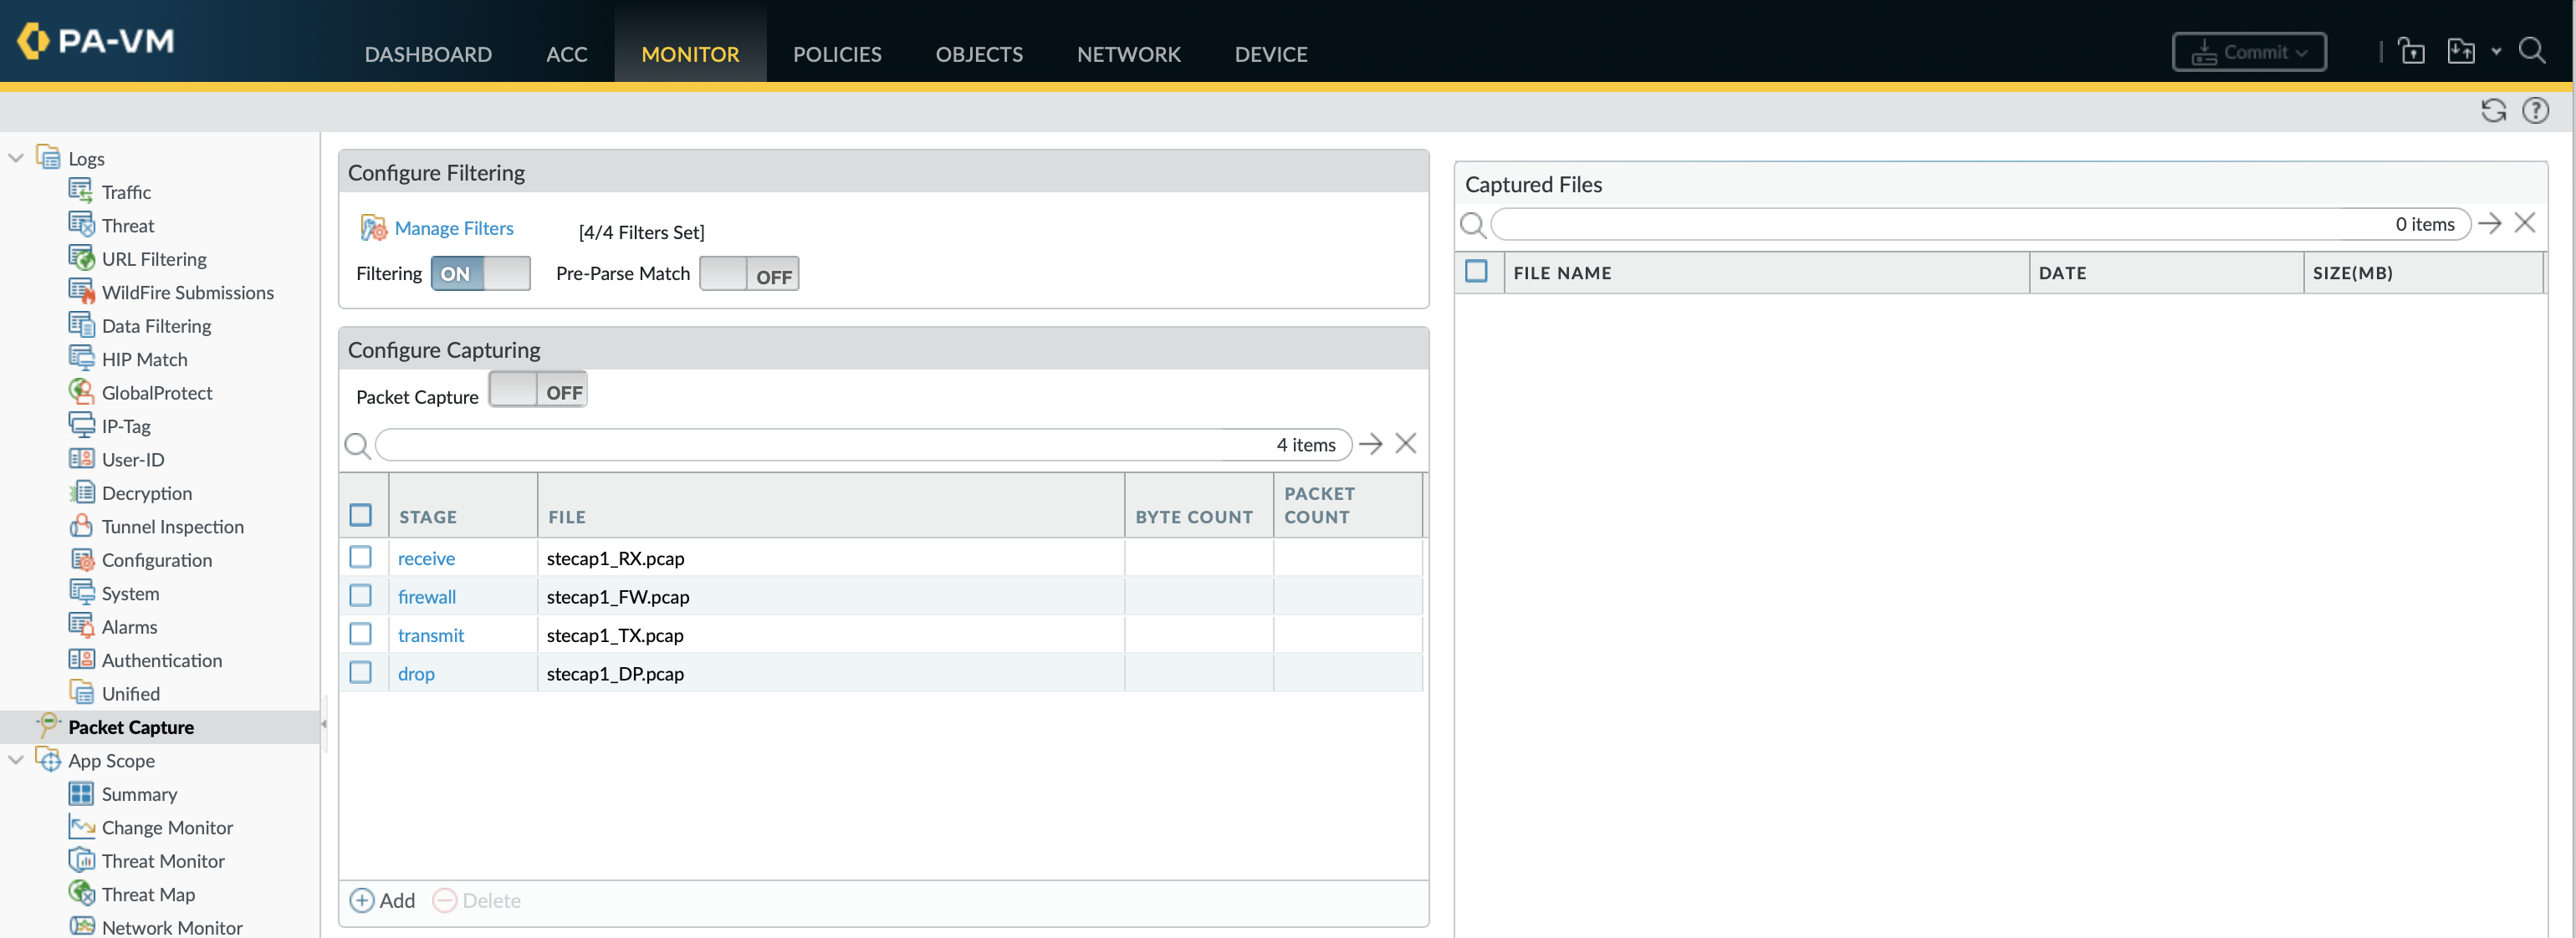
There are four points (stages) at which packets can be captured with the results each saved in a separate file. To be able to run a capture at least one capture stage must be defined.
- Drop: Packet processing encounters an error and the packet is dropped (before firewall policy)
- Receive: Packet is received on the dataplane processor (inbound to firewall but not yet the firewall policy)
- firewall: Packet is inspected against policy (a session created from the first packet or an existing session matched)
- Transmit: Packet is transmitted on the dataplane processor (processed by the firewall policy and leaving the firewall)
In the same command can also set the maximum byte-count and packet-count after which captures are stopped (default is 0, so unlimited).
ste@HME-PAL-OEW1> debug dataplane packet-diag set capture stage drop
+ byte-count     Max. byte count before filter stops
+ packet-count   Max. packet count before filter stops
* file           Saved file name, alphanumeric string [ 0-9a-zA-Z._-]
This creates capture files (.pcap) for all 4 stages.
debug dataplane packet-diag set capture stagedrop filestecap1_DP.pcap debug dataplane packet-diag set capture stagereceive filestecap1_RX.pcap debug dataplane packet-diag set capture stagefirewall filestecap1_FW.pcap debug dataplane packet-diag set capture stagetransmit filestecap1_TX.pcap
The Snapshot Length (snaplen) is the amount of data for each frame that is actually captured and stored into the capture file. By default the snaplen is set to 0 which means it will use the maximum length required to capture whole packets.
debug dataplane packet-diag set capture snaplen40-65535
Pre-Parse match can be used to capture before processing by the engines running on the dataplane (before reaching the filtering stage). Should only be used as a last resort at low traffic times as it emulates a positive match for EVERY packet entering the system (captures everything).
Running the capture
As packet captures are session-based only new sessions are captured meaning that at times there maybe a need to clear existing sessions to also capture that traffic. The filters used with the show and clear session commands include most of the filter indexes as well as many more.
debug dataplane packet-diag set captureon Start the packet capture show session allTo check there are session that match the capture debug dataplane packet-diag show settingShows the number of bytes and packets for each capture stage view-pcap follow yes filter-pcapcapture_name.pcap View the capture in real-time debug dataplane packet-diag set captureoff Stop the packet capture show session allSee all sessions through the firewall show session all filter source10.10.64.202 destination-port443 Show HTTPS sessions from 10.10.64.202 clear session idid Clear a specific session clear session all filter source10.10.64.202 destination-port443 Clear all HTTPS sessions from 10.10.64.202
The settings will show the number of packets and bytes captured by each stage.
ste@HME-PAL-OEW1> debug dataplane packet-diag show setting

--------------------------------------------------------------------------------
Packet diagnosis setting:
--------------------------------------------------------------------------------
Packet filter
  Enabled:                   yes
  Match pre-parsed packet:   no
  Filter offload:            yes
  Index 1: 10.10.64.0/24[0]->0.0.0.0/0[443], proto 0
           ingress-interface any, egress-interface any, exclude non-IP
  Index 2: 0.0.0.0/0[443]->10.10.64.0/24[0], proto 0
           ingress-interface any, egress-interface any, exclude non-IP
  Index 3: 0.0.0.0/0[0]->8.8.8.8/32[53], proto 0
           ingress-interface any, egress-interface any, exclude non-IP
  Index 4: 8.8.8.8/32[53]->0.0.0.0/0[0], proto 0
           ingress-interface any, egress-interface any, exclude non-IP
--------------------------------------------------------------------------------
Logging
  Enabled:                   no
  Log-throttle:              no
  Sync-log-by-ticks:         yes
  Features:
  Counters:
  Timeout duration:          60 seconds
  Buffer threshold:          80%
  CPU threshold:             80%
--------------------------------------------------------------------------------
Packet capture
  Enabled:                   yes
  Snaplen:                   0
  Username:
  Stage receive           :  file stecap1_RX.pcap
    Captured:     packets - 7948       bytes - 6822396
    Maximum:      packets - 0          bytes - 0
  Stage firewall          :  file stecap1_FW.pcap
    Captured:     packets - 7200       bytes - 6414493
    Maximum:      packets - 0          bytes - 0
  Stage transmit          :  file stecap1_TX.pcap
    Captured:     packets - 7271       bytes - 6639097
    Maximum:      packets - 0          bytes - 0
  Stage drop              :  file stecap1_DP.pcap
    Captured:     packets - 12         bytes - 720
    Maximum:      packets - 0          bytes - 0
--------------------------------------------------------------------------------
The system knows which packets to capture and write to the file (when they reach the designated capture stage) based on filter marked sessions. Once the filter is made active these markings are added to a matching session when it is created. When a packet capture is started sessions that existed before the filter was activated will not be included in the capture, these can be added to the marked sessions manually.
debug dataplane packet-diag show filter-marked-sessionShow all the marked (tagged) sessions debug dataplane packet-diag set filter-marked-session idsession_ID Add an existing session to the marked sessions
View, download and post-capture cleanup
On capture completion is a good idea to clear filter markings to avoid long-lived session being inadvertently captured by subsequent captures.
debug dataplane packet-diag clear filter-marked-session alldebug dataplane packet-diag clear filter-marked-session idsession_ID
The packet capture can be viewed from the CLI (headers only) or the full packet capture downloaded and viewed in wireshark.
view-pcap followyes filter-pcapstecap1_TX.pcap View the capture in real-time view-pcap filter-pcapstecap1_TX.pcap View a packet capture scp export filter-pcap fromstecap1_TX.pcap to ste@10.10.64.202:mgmt.pcap Download a packet capture
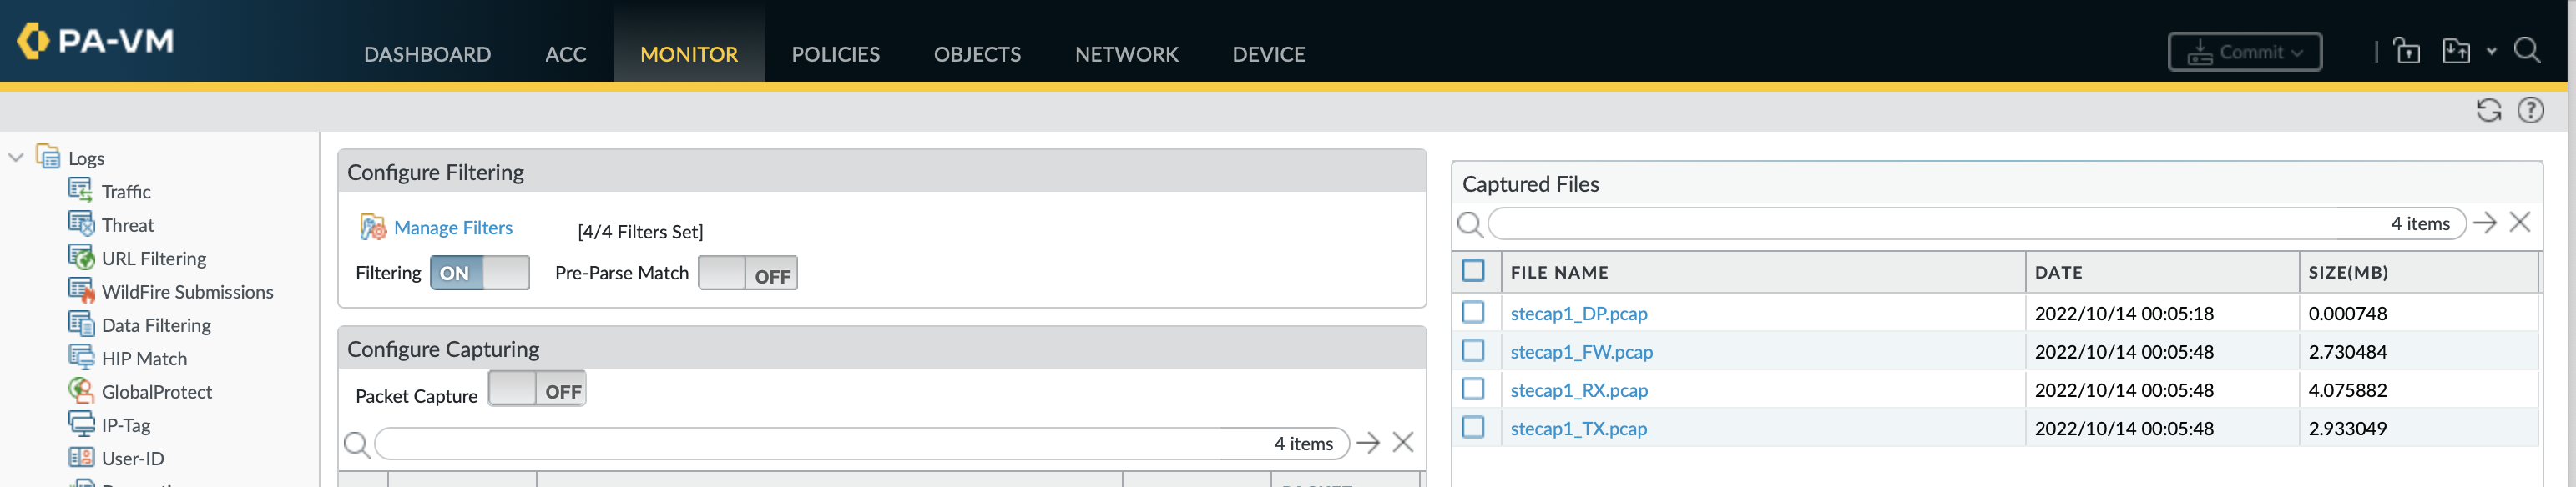
It maybe easier to downloaded these locally from the GUI by clicking on any captures in Monitor » Packet Capture.
Filters, stages and settings can be removed individually or all settings removed as a whole.
debug dataplane packet-diag clear filter index <1-4>
debug dataplane packet-diag clear capture stage [ drop | firewall | receive | transmit]
debug dataplane packet-diag clear capture snaplen
debug dataplane packet-diag clear all
This does not cleanup the capture files, these must be deleted separately.
delete debug-filter file stecap1_RX.pcap
delete debug-filter file stecap1_FW.pcap
delete debug-filter file stecap1_TX.pcap
delete debug-filter file stecap1_DP.pcap
Debug packet flow
A useful troubleshooting option when sessions browser, traffic logs or packet captures didn’t help as it will log the packets as they pass through each stage and process of the firewall. Inspecting the flows can be very labor-intensive so to ensure the device is not overloaded use strict filters and keep an eye on resources (show running resource-monitor second). There are many features that can be logged with each having its own set of sub-features, to log packet flows use flow and basic.
Before starting is best to clear all counters and unmark any sessions that were marked by previous filters.
debug dataplane packet-diag clear allClear all capture settings, counters and filters debug dataplane packet-diag clear filter-marked-session allUnmark any sessions that were marked by previous filters debug dataplane packet-diag clear log logClear any previous logs
Packet flow logging leverages the same filters (can configure upto 4 filters) as used by packet captures.
debug dataplane packet-diag set filter match destination8.8.8.8 destination-port53 debug dataplane packet-diag set filter match source8.8.8.8 source-port53 debug dataplane packet-diag set filteron Enable the filters debug dataplane packet-diag set log featureflow basic Set debugging to log flows debug dataplane packet-diag set logon Enable debugging debug dataplane packet-diag set logoff Disable debugging
Each firewall session is assigned to a specific core for processing with each core logging to its own file. This means that the resulting packet-diag logs will be spread over multiple pan_task_x.log files, use the command debug dataplane packet-diag aggregate-logs to aggregate these into a single file (pan_packet_diag.log). VM-series firewalls save these as management-plane logs (mp-log) whilst larger physical platforms save these as dataplane logs (dp-log).
As with packet captures the results can be seen in realtime (follow yes), viewed on the device (tail, less) or exported off the device (scp, ftp, tftp).
less dp-logpan_packet_diag.log View logs on larger physical platforms less mp-logpan_task_1.log View logs on VM-series and small physical platforms tail followyes mp-logpan_task_1.log Live realtime logs (VM-series) debug dataplane packet-diag aggregate-logsAggregate the different core logs into pan_packet_diag.log less mp-logpan_packet_diag.log View aggregated log file grep mp-logpan_packet_diag.log patternregex Match parts of log file based on regex scp export log-filemanagement-plane tousername@host:path Exports tar of all logs to management-plane_name.tar.gz
Reference
KB article on running packet captures from CLI and GUI
Good blog on packet captures and more trouble shooting things such as global counters