As I travel further north on the canals the mobile signal coverage is gradually getting worse so I decided to build a monitoring solutions to help with deciding where to moor. My initial idea was to use an Intel NUC or RaspberryPi with a 12v PSU, but then a friend told me about how he was monitoring his home lab using kubernetes on an old android phone, it sounded like the perfect solution.
I can’t believe I never thought about this sooner, the way phones have been evolving the specs of even the older models are sufficient for what I need. Phones are designed for 24/7 operation so are very power-efficient, the built-in battery provides natural UPS functionality (doesn’t need to be plugged in all the time) and have got both wifi and cellular if need be.
For the monitoring solution I deployed a TIG stack and Prometheus:
- Telegraf: The agent for collecting and reporting metrics and data, so the receiver or collector of streaming telemetry data. It uses plug-ins for collecting and reporting metrics and can send the metrics to files, message queues, and other endpoints (InfluxDB, Graphite, Kafka, MQTT)
- InfluxDB: The time series database (TSDB) of the stack, it is optimized for fast, high-availability storage and retrieval of time series data
- Prometheus: A monitoring and alerting tool that uses Prometheus Query Language (PromQL) to retrieve and manipulate data for analysis and visualization. It collects (pulls) metrics from targets by scraping HTTP endpoints (for example an snmp or node exporter) and stores metrics as time-series data, recording information with a timestamp. It acts as a data source for other data visualization libraries like Grafana
- Grafana: Extracts data from databases like InfluxDB or Prometheus, performs basic or advanced data analytics, and creates dashboards
I will be using the above tools to monitor the following:
- Network health: The telegraf plugins will monitor ICMP (RTT, packet loss), HTTP (response times) and DNS sending data to InfluxDB
- Phone (server): Prometheus (node-exporter) will monitor the phone (Kubernetes node) and monitoring applications (Kubernetes pods)
- Teltonika router: Prometheus (snmp-exporter) will monitor the routers health, cellular signal and traffic via SNMP
- Victron equipment: Victron Cerbo GX uses MQTT to share data with Telegraf (and InfluxDB), the idea is to have local dashboard rather than relay on the Internet dependant Victron VRM
Table Of Contents
PostmarketOS on OnePlus6
The first thing to do was get an old android phone, I am following the steps on Plamen’s blog so it made sense to get the same OnePlus6. I picked up a 128GB version with a cracked screen off ebay for £32. For the build am using a Ubuntu VM (Fusion on mac), first install required packages:
sudo apt install android-tools-adb android-tools-fastboot android-sdk udev
On the phone enable Developer Options and change settings to allow you to console into it (using fastboot):
- Navigate to Settings » About Phone, tap the Build Number 7 times until you see “developer mode activated”
- Go back to Settings » Developer Options, enable both “OEM unlocking” (to modify the firmware) and “USB debugging” (to console to it)
- Enter fastboot mode by powering off the device and holding Volume Up + Power until you see “START”
Connect the phone to mac, in fusion popup “connect to linux”, then on Linux VM use the below commands to make sure you can see the phone (fastboot is the program to connect via console) and then oem unlock it so it can be flashed with PostmarketOS.
sudo fastboot devices                                  # Verify connection
sudo fastboot oem unlock
PostmarketOS (pmOS) is a lightweight operating system based on Alpine Linux that is primarily for smartphones. I couldn’t get pmbootstrap to install with pip (as per blog) so instead downloaded from git and installed manually, you have to logout/login for the environment to be updated.
git clone https://gitlab.postmarketos.org/postmarketOS/pmbootstrap.git
cd pmbootstrap
mkdir -p ~/.local/bin
ln -s "$PWD/pmbootstrap.py" ~/.local/bin/pmbootstrap

# logout and back in
pmbootstrap --version                                 # Verify pmbootstrap is installed
Enter pmbootstrap init to initialize the pmbootstrap environment (set build options), follow the prompts using these non-default settings:
- Vendor: oneplus
- Device: enchilada
- Username: whatever_you_want
- User interface: console (we’re building a server, not a phone)
- Additional packages: networkmanager-cli,networkmanager-tui,wpa_supplicant,nano
Finally install and export are used to build the pmOS image and present it to fastboot which then uses this to flash the phone.
pmbootstrap install
sudo fastboot erase dtbo
pmbootstrap export
sudo fastboot flash userdata /tmp/postmarketOS-export/oneplus-enchilada.img
sudo fastboot flash boot /tmp/postmarketOS-export/boot.img
sudo fastboot reboot
Once completed and the phone has rebooted you should be presented with a standard linux login page. The phone showed up in mac networking as an adapter called “OnePlus 6” with a DHCP IP of 172.16.42.2, can connect using ssh ste@172.16.42.1. First thing to do is get the phone on your WiFi network, the final few commands are just to verify network connectivity.
sudo nmcli connection add \
    con-name "static-wifi" \
    type wifi \
    ifname wlan0 \
    ssid "WIFI_SSID"
sudo nmcli connection modify static-wifi \
    ipv4.method auto \
    wifi-sec.key-mgmt wpa-psk \
    wifi-sec.psk "WIFI_PASSWORD"
sudo nmcli connection up static-wifi

ip a
route
nmcli connection show static-wifi
ping google.com
Can now update the current packages and add anything else you may require. The blog I followed sets up the builtin firewall rules (nftables), as I wont be using the SIM and the phone is behind a firewall I don’t see any point in this so disabled the nftables service.
sudo apk update
sudo apk upgrade
sudo apk add networkmanager wpa_supplicant vim htop curl nano tcpdump
sudo rc-service nftables stop
sudo rc-update del nftables default
Container infrastructure (Docker and K3s)
Containers are lightweight self-contained application packages, kind of like a virtual machine but rather than virtualising the hardware it virtualises just the application (bare minimum) with containers sharing the host OS kernel. K3s is a lightweight version of Kubernetes designed for resource constrained environments, it adds a layer of abstraction providing an easier and more scalable way to manage and orchestrate containers.
K3s needs a container runtime, for this purpose we will use Docker which can be installed with the package manager (apk).
sudo apk add docker
sudo addgroup ste docker
sudo rc-update add docker default
sudo rc-service docker start

sudo reboot                                        # Reboot and check that docker service is starting at bootup
rc-service docker status
K3s has to be installed using a script, --docker specifies the container runtime (default is containerd) and --disable=traefik stops it creating a traefik container as instead I will be using nginx as the ingress controller (proxy to gain access to container remotely on custom port).
curl -sfL https://get.k3s.io | sh -s - --docker --disable=traefik
To check K3s is running and healthy
htop                            # Check resources
rc-status                       # docker and k3s should be listed as started under Runlevel: default
sudo kubectl cluster-info       # Check all elements are running, should have Kubernetes control plane, CoreDNS and Metrics-server
sudo kubectl get nodes          # The node should be in a ready state
sudo kubectl get service        # Will give you the cluster IP
The following 3 pods (containers) are deployed as part of the install (in the kube-system namespace):
- CoreDNS: A flexible, extensible DNS server that can serve as the Kubernetes cluster DNS (where K3s service records are created)
- local-path-provisioner: Provides a way for the Kubernetes users to utilize the local storage in each node. Based on config will create either hostPath or local based persistent volume on the node automatically
- metrics-server: Fetches resource metrics from kubelets and exposes them in the Kubernetes API server through the metrics API, you can also view these metrics using the kubectl top command
$ sudo kubectl get pods --namespace kube-system           # Pods should be 'ready' and 'running' ('docker ps' also shows docker containers)
NAME                                      READY   STATUS    RESTARTS      AGE
coredns-ccb96694c-rrd7w                   1/1     Running   1 (117s ago)    43m
local-path-provisioner-5cf85fd84d-48j25   1/1     Running   1 (117s ago)   43m
metrics-server-5985cbc9d7-qsthp           1/1     Running   1 (117s ago)   43m
If you come across any issues when building the pods the best place to start looking is the pod logs (for all or individual pods), it also shows details about the configuration and status.
sudo kubectl describe pod --namespace kube-system                                             # View for all pods
sudo kubectl describe pod coredns-ccb96694c-rrd7w --namespace kube-system
sudo kubectl describe pod local-path-provisioner-5cf85fd84d-48j25 --namespace kube-system
sudo kubectl describe pod metrics-server-5985cbc9d7-qsthp --namespace kube-system
Kubernetes (K3s)
At this point K3s is up and running and we are ready to start installing the monitoring containers. K3s is API based and kubectl is a command line tool used to interact with the API. To avoid having to use sudo with kubectl you can change the permission of the API file with sudo chmod 644 /etc/rancher/k3s/k3s.yaml, this will not survive reboots.
Before installing anything it is probably worth going through some of the Kubernetes elements involved and the commands used to view them.
-
node: The worker or master machines. Each node contains all the services and compute resources (CPU, volumes, etc) necessary to host and execute pods (containers are placed into pods). Typically would have have several nodes in a cluster
kubectl get nodes -
namespaces: A mechanism for isolating groups of resources (must be unique) to better organize, allocate, and manage cluster resources (for example the core K3s elements created as part of the install are in kube-system). By default kubectl operates in the default namespace, must add
-n/--namespaceto the kubectl commands to specify a specific namespace or--all-namespacesfor all namespaceskubectl get namespace -
pod: A pod (as in a pod of whales) is a single deployment unit in K3s containing one or more containers that work together to run an application. Pods are responsible for running the application’s containers in the Kubernetes cluster, it is a single instance of a running application. Even though a pod can run multiple containers, it is common practice to run a single container in a pod.
- Every Pod gets its own dedicated network stack and unique IP address from the pod network range that is managed by the network provider plugin, this is not tied to the node that the pod is running on
kubectl get pods --all-namespaces kubectl get pod -o wide --all-namespaces # More detailed table including IP and node name - Every Pod gets its own dedicated network stack and unique IP address from the pod network range that is managed by the network provider plugin, this is not tied to the node that the pod is running on
-
services: Adds a layer of abstraction to inter-pod traffic as services sit in front of pods with there own dedicated DNS name, IP, local port (service port that will forward to target port), target port (container port) and node port (to access externally). Pods can communicate using the assigned service DNS names (service_name.namespace_name.svc.cluster.local.) which resolves to ClusterIP rather than hardcoding endpoint IPs and ports. This abstraction enables loose coupling between pods so that pods can be created, moved, scaled, and destroyed without impacting connectivity between other pods. For different application use cases you can have a different types of service:
- ClusterIP - Exposes the service on an internal cluster IP, the service is only reachable within the cluster
- NodePort - Exposes the service on the same port of each selected node in the cluster using NAT (accessible from outside the cluster)
- LoadBalancer - Creates an external load balancer in the cloud provider and assigns a fixed external IP to the service
- ExternalName - Exposes the service using an arbitrary name by returning a CNAME record with the name (no proxy is used)
kubectl get services --all-namespaces -
ingress: Are often used in conjunction with services to control external access (expose services externally) typically based on HTTP and HTTPS routes (rules). Can consolidate multiple HTTP (or HTTPS) network services under a single external IP address using a protocol-aware configuration mechanism that understands web concepts like URIs, hostnames, paths and so forth
kubectl get ingress --all-namespaces -
deployment: K3s aims to maintain the desired state of the application at all times and a deployment describes that desired state through a YAML file. It is a recipe for the pod holding all the ingredients needed such as image, port, replicas and so on, kind of like a Dockerfile
kubectl get deployment --all-namespaces
In the one file you can combine the deployment with other elements such as namespace, services, and ingress, this is then called a manifest and can be deployed with the one kubectl apply -f manifest.yaml command.
Managing K3s remotely with kubectl
kubectl interacts with K3s cluster API server by using the /etc/rancher/k3s/k3s.yaml file, therefore to connect to K3s from a remote host with kubectl all you need to do is copy this file over and change the IP address (127.0.0.1) that the certificate has been issued to in the file. Use homebrew to install kubectl on mac and then copy the k3s.yaml file over saving it as ~/.kube/config, this is the default file kubectl will look for.
brew install kubernetes-cli
scp /etc/rancher/k3s/k3s.yaml mucholoco@10.40.20.167:~/.kube/config
In the file change the line server: https://127.0.0.1:6443 to server: https://YOUR_K3S_NODE_IP:6443
nano ~/.kube/config
apiVersion: v1
clusters:
- cluster:
    certificate-authority-data:
BLAH..........
    server: https://127.0.0.1:6443
Can now verify the kubectl client and server version and check that you can run commands against the cluster.
kubectl --kubeconfig="k3s.yaml" version --short
kubectl get nodes
NAME            STATUS   ROLES                  AGE     VERSION
boa-pos-kbs01   Ready    control-plane,master   6d23h   v1.31.5+k3s1
krew and ksniff
Krew is a kubectl tool used to discover, manage and install kubectl_plugins. There are over 100 kubectl plugins supported by Krew, ksniff is useful for troubleshooting as it can do pod packet captures. Install krew using homebrew and add $HOME/ .krew/bin to your PATH, I use zshrc.
brew install krew
nano ~/.zshrc

# Path for Krew kubectl plugins
export PATH="${PATH}:${HOME}/.krew/bin"
Update krew and then install ksniff
kubectl krew update
kubectl krew search                         # See all available plugins
kubectl krew list                           # See all installed plugins
kubectl krew info sniff                     # See info on a specific plugins
kubectl krew install sniff
ksniff uses kubectl to upload and deploy a statically compiled tcpdump binary to the K3s node redirecting it’s output to your local wireshark, when you close wireshark the pod is automatically deleted. The default tcpdump binary is not compatible with the pmOS node platform (linux/arm64/v8) so I used a pre-built ‘ghcr.io/nefelim4ag/tcpdump:latest’ container (couldn’t be bothered building my own).
By default ksniff only waits 1 minute to pulldown and build the image, on the first run you may need to increase this (–pod-creation-timeout) to take into account for the image downloaded.
kubectl sniff -p --tcpdump-image ghcr.io/nefelim4ag/tcpdump:latest <POD_NAME_TO_CAPTURE> -f "<TCPDUMP FILTERS>"
Can use all the usual tcpdump filters which are passed into the pod when its built, these are some I used when tshooting snmp-exporter issues:
kubectl sniff -p --tcpdump-image ghcr.io/nefelim4ag/tcpdump:latest snmp-exp-prometheus-snmp-exporter-7d94d9845-kg2bl -n monitoring -f "port 9116"
kubectl sniff -p --tcpdump-image ghcr.io/nefelim4ag/tcpdump:latest snmp-exp-prometheus-snmp-exporter-7d94d9845-kg2bl -n monitoring -f "port 161"
kubectl sniff <your-apache-pod-name>  -f "port 8080" -p
kubectl sniff <your-coredns-pod-name> -p -n kube-system -o dns.pcap          # Capture to file rather than view in real time with wireshark
Helm
Helm is a package manager for Kubernetes that simplifies application deployment and management by providing a higher-level abstraction for manifest files. It streamlines deployments by packaging the manifests into a single ‘Helm chart’, these charts come with default values which can be overridden (combined/merged) at run time from a file (-f), with individual custom values (--set) or a combination of both.
sudo apk add helm                                   # Install Helm
sudo nano /etc/profile
# add this to the profile
export KUBECONFIG=/etc/rancher/k3s/k3s.yaml
Like with kubectl the helm commands are namespace aware (-n):
helm search hub <string>                           # Search charts in the artifact Hub (like docker hub) that match the string
helm repo add <chart_name> <chart_url>             # Add that remote repo into local Helm registry, repos normally hold multiple charts
helm repo update                                   # Gets the latest info about charts from the respective chart repos (data used by helm search)
helm repo list                                     # List the locally added repos
helm search repo <string>                          # Search local repos for charts containing the string (repos contain multiple charts)

helm show values <helm_chart>                      # Shows default values.yaml file with all configurable options (and detailed comments)
helm install <name> <helm_chart> [-f values.yaml] --dry-run --debug   # Shows all the values that will be used for the build (what manifest would look like)
helm install <name> <helm_chart> [-f values.yaml]  # Install app, 'app_name' is appended to 'name' in all k3s objects (e.g. myapp-influxdb2)
helm get notes <name>                              # To review install notes on the install (how to access, creds, etc)

helm list -n monitoring                            # View all builds (installs), helm revision and status (should be deployed)
helm get values <name> -n monitoring               # View the custom values (fed in by you) for this build
helm get manifest <name> -n monitoring             # View the manifest for this build (merged default and custom values)
helm get all <name> -n monitoring                  # Shows everything, have a sections for USER-SUPPLIED VALUES and COMPUTED VALUES (defaults)

helm upgrade <name> <helm_chart> [-f values.yaml] [--dry-run --debug]  # To rebuild the app, for example if have changed some values
helm history <name>                                # See releases, are produced each time perform helm upgrade
helm rollback <name> <revision>                    # Rollback to a previous release (revision number)
helm uninstall <name>                              # Delete all elements of a helm deployment
Each K3 element created by helm uses the naming format <helm_name>-<app_name>, for example helm install tiginfl influxdata/influxdb2 will create a pod called tiginfl-influxdb2-0 (last number is app version). Alternatively pass in -g to have helm automatically generate an app name.
As helm runs against the K3s API (k3s.yaml file) I guess just like kubectl you could install this remotely and run it from there, I just run it locally as I only have one K3s node.
Monitoring stack build
This involves installing 3 separate applications using helm charts, the first thing to do is add and update the helm repos (influxdb and telegraf are in the same repo). The pod deployments will require a degree of customisation that will be done using value.yaml files fed in at runtime, all applications will be deployed in the monitoring namespace.
helm repo add influxdata https://helm.influxdata.com/
helm repo add grafana https://grafana.github.io/helm-charts
helm repo update

kubectl create namespace monitoring                   # Creates the monitoring namespace apps will be deployed into
mkdir helm_values                                     # Create directory to hold all the value files
InfluxDB
By default the InfluxDB helm chart retains data across reboots, therefore all that needs setting in the influxdb_values.yaml file is prometheus monitoring, the db bucket information, credentials and the k3s service.
image:
  repository: influxdb
  tag: latest
podAnnotations:
  prometheus.io/port: "8086"
  prometheus.io/scrape: "true"
adminUser:
  organization: "stesworld"
  bucket: "stebucket"
  user: "admin"
  retention_policy: "90d"
  password: "pa$$w0rd"
  token: "NIXkAW3LErwAeJIyYG3CVOawv8e-a3k7WZMCPR7hknjYEISTItMBg8yPKEjKIZMYUIBncy80SuYbso=="
service:
  type: ClusterIP
  port: 8086
  targetPort: 8086
  annotations:
    prometheus.io/scrape: "true"
    prometheus.io/port: "8086"
The helm chart is deployed in the monitoring namespace with the settings from the values file (fed in at runtime) merged with the default values.
helm install infl influxdata/influxdb2 -f helm_values/influxdb_values.yaml -n monitoring --dry-run --debug      # Optionally do a dry-run first
helm install infl influxdata/influxdb2 -f helm_values/influxdb_values.yaml --namespace monitoring
Can use kubectl to view the different K3s elements created, so pod, service, secret, statefulset and persistent volumes (for persistent storage).
$ kubectl get pod -n monitoring
NAME              READY   STATUS    RESTARTS   AGE
infl-influxdb2-0  1/1     Running   0          16m
$ kubectl get service -n monitoring
NAME            TYPE        CLUSTER-IP     EXTERNAL-IP   PORT(S)    AGE
infl-influxdb2  ClusterIP   10.43.199.15   <none>        8086/TCP   17m
$ kubectl get secret -n monitoring
NAME                        TYPE                 DATA   AGE
infl-influxdb2-auth         Opaque               2      18m
$ kubectl get statefulset -n monitoring
NAME            READY   AGE
infl-influxdb2  1/1     18m
$ kubectl get pv -n monitoring
NAME                                       CAPACITY   ACCESS MODES   RECLAIM POLICY   STATUS   CLAIM                      STORAGECLASS   VOLUMEATTRIBUTESCLASS   REASON   AGE
pvc-662d3a4b-a150-4996-b772-87c4a5364e96   50Gi       RWO            Delete           Bound    monitoring/infl-influxdb2  local-path     <unset>                          19m
The influxdb dashboard is only accessible from within the K3s node, a NodePort service is required to access it remotely (http://k3s_ip:nodeport).
kubectl expose service infl-influxdb2 --type=NodePort --target-port=8086 --name=infl-influxdb2-ext --namespace monitoring
$ kubectl get service -n monitoring
NAME                TYPE        CLUSTER-IP      EXTERNAL-IP   PORT(S)              AGE
infl-influxdb2      ClusterIP   10.43.199.15    <none>        8086/TCP             21m
infl-influxdb2-ext  NodePort    10.43.62.18     <none>        8086:31122/TCP       6m26s
Can now log into http://k3s_node_ip:nodePort with the creds from the value file, should see the stebucket but it won’t hold any data yet.
Telegraf
The Telegraf helm chart values file includes the telegraf config of ‘what will be monitored’ (inputs) and ‘where that data will be sent’ (outputs). Replace the output.influxdb_v2.urls with the DNS name of the influxdb service (http://<service_name>.monitoring.svc.cluster.local:8086).
- Input plugins collect metrics from the system, services, or third-party APIs
- cisco_telemetry_mdt: Not needed for boat monitoring, is for model-driven telemetry from my cisco labs devices
- http_response: Generates metrics from HTTP responses including the status code and response statistics
- ping: Measures ICMP round-trip response time and packet loss
- dns_query: Gathers DNS query times in milliseconds
- Output plugins write metrics to various destinations (can also write to file for troubleshooting)
- influxdb_v2: Uses the influxdb pods service DNS name and token to write data to the DB bucket
- prometheus_client: Exposes metrics (on /metrics) so the pod can be monitored by a prometheus (as telegraf pod doesn’t have a port)
image:
  repo: "docker.io/library/telegraf"
  tag: latest
env:
  - name: HOSTNAME
    value: "k3s-telegraf"
podAnnotations:
  prometheus.io/port: "8888"
  prometheus.io/scrape: "true"
config:
  outputs:
    - influxdb_v2:
        urls:
          - "http://infl-influxdb2.monitoring.svc.cluster.local:8086"
        token: "NIXkAW3LErwAeJIyYG3CVOawv8e-a3k7WZMCPR7hknjYEISTItMBg8yPKEjKIZMYUIBncy80SuYbso=="
        organization: "stesworld"
        bucket: "stesbucket"
    - prometheus_client:
        listen: ":8888"
  inputs:
    - cisco_telemetry_mdt:
        transport: "grpc"
        service_address: ":57000"
    - http_response:
        urls:
          - "https://google.com"
          - "https://bbc.co.uk"
        response_timeout: "10s"
        method: "GET"
    - ping:
        urls:
          - "google.com"
          - "bbc.co.uk"
          - "1.1.1.1"
          - "8.8.8.8"
          - "10.40.10.1"
        arguments: ["-c", "3", "-i", "5.0"]
    - dns_query:
        servers:
          - "8.8.8.8"
          - "1.1.1.1"
        record_type: "A"
        timeout: "2s"
Due to the extra configuration is a good idea to first do a dry-run on the build to pick up any errors and check the merged values.
helm install tele influxdata/telegraf -f helm_values/telegraf_values.yaml -n monitoring --dry-run --debug      # Optionally do a dry-run first
helm install tele influxdata/telegraf -f helm_values/telegraf_values.yaml -n monitoring

$ kubectl get all -n monitoring | grep egrep 'tele|NAME'
pod/tele-telegraf-546758596b-8t8rf                       1/1     Running   0                 2m33s
service/tele-telegraf                         ClusterIP   10.43.88.115    <none>        57000/TCP,8888/TCP   2m33s
deployment.apps/tele-telegraf                       1/1     1            1           2m33s
replicaset.apps/tele-telegraf-546758596b                       1         1         1       2m33s
Now if you log into influxDB GUI should see the input plugins (http_response, ping, dns_query) and fields for the different types of data received.
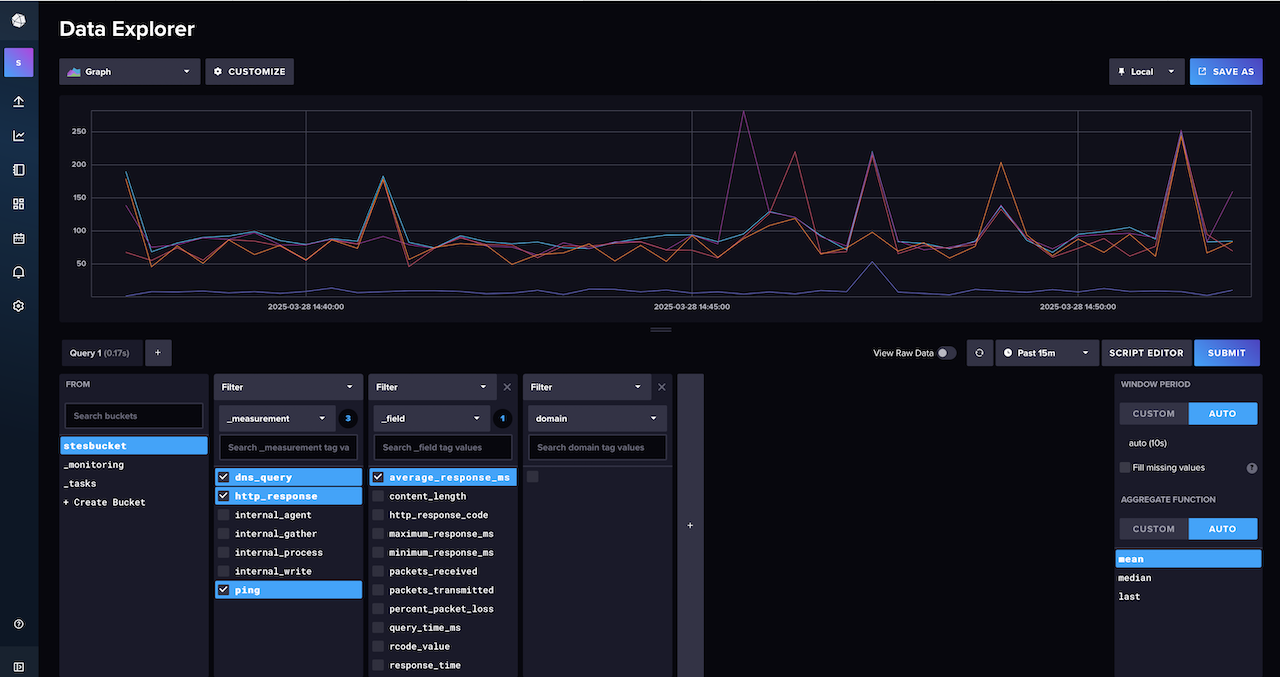
If you are not seeing any data the best place to start looking is the pod logs (application logs), will see the data collected and sent by the plugins as well as any errors. If you need to make any changes to the configuration (values file) have to rebuild the pod to apply it using upgrade.
kubectl logs tele-telegraf-546758596b-8t8rf -n monitoring
kubectl logs infl-influxdb2-0  -n monitoring

helm upgrade tele influxdata/telegraf -f helm_values/telegraf_values.yaml -n monitoring
Grafana
The grafana helm chart needs persistence enabling (to retain data access reboots) and the data sources adding (influx and prometheus). I tried loading public and custom dashboards as part of the build but deploying dashboards from code is an all or nothing thing, once deployed you can’t manually edit them in the GUI (may revisit once finished tweaking my dashboards). It is worth noting that to load custom dashboards you need to use helm templates (K3s configmap) which means you have to deploy them using your own local version of the helm chart (not from helm repo).
podAnnotations:
  prometheus.io/scrape: "true"
  prometheus.io/port: "3000"
service:
  enabled: true
  type: ClusterIP
  port: 3000
  targetPort: 3000
  portName: service
  annotations:
    prometheus.io/scrape: "true"
    prometheus.io/port: "3000"
persistence:
  type: pvc
  enabled: true
adminUser: admin
adminPassword: "<ADD_PASSWORD>"
plugins:
  - grafana-clock-panel
datasources:
  datasources.yaml:
    apiVersion: 1
    datasources:
      - name: influxdb-influxQL
        type: influxdb
        access: proxy
        url: http://infl-influxdb2.monitoring.svc.cluster.local:8086
        jsonData:
          dbName: stesbucket
          httpHeaderName1: "Authorization"
        secureJsonData:
          httpHeaderValue1: "Token <ADD_TOKEN>"
      - name: prometheus
        type: prometheus
        url:  http://prom-prometheus-server.monitoring.svc.cluster.local:80
Deploy the application (optionally do a dry-run first) and then add a NodePort service to allow for remote access to the grafana GUI.
helm install graf grafana/grafana -f helm_values/grafana_values.yaml -n monitoring --dry-run --debug      # Optionally do a dry-run first
helm install graf grafana/grafana -f helm_values/grafana_values.yaml -n monitoring
kubectl expose service graf-grafana --type=NodePort --target-port=3000 --name=graf-grafana-ext --namespace monitoring

$ kubectl get all --namespace monitoring | grep grafa
pod/graf-grafana-567668fbd-7lnvd                         1/1     Running   0               31m
service/graf-grafana                          ClusterIP   10.43.206.84   <none>        3000/TCP             31m
graf-grafana-ext                              NodePort    10.43.40.53     <none>       3000:30605/TCP       31m
deployment.apps/graf-grafana                        1/1     1            1           31m
replicaset.apps/graf-grafana-567668fbd                         1         1         1       31m
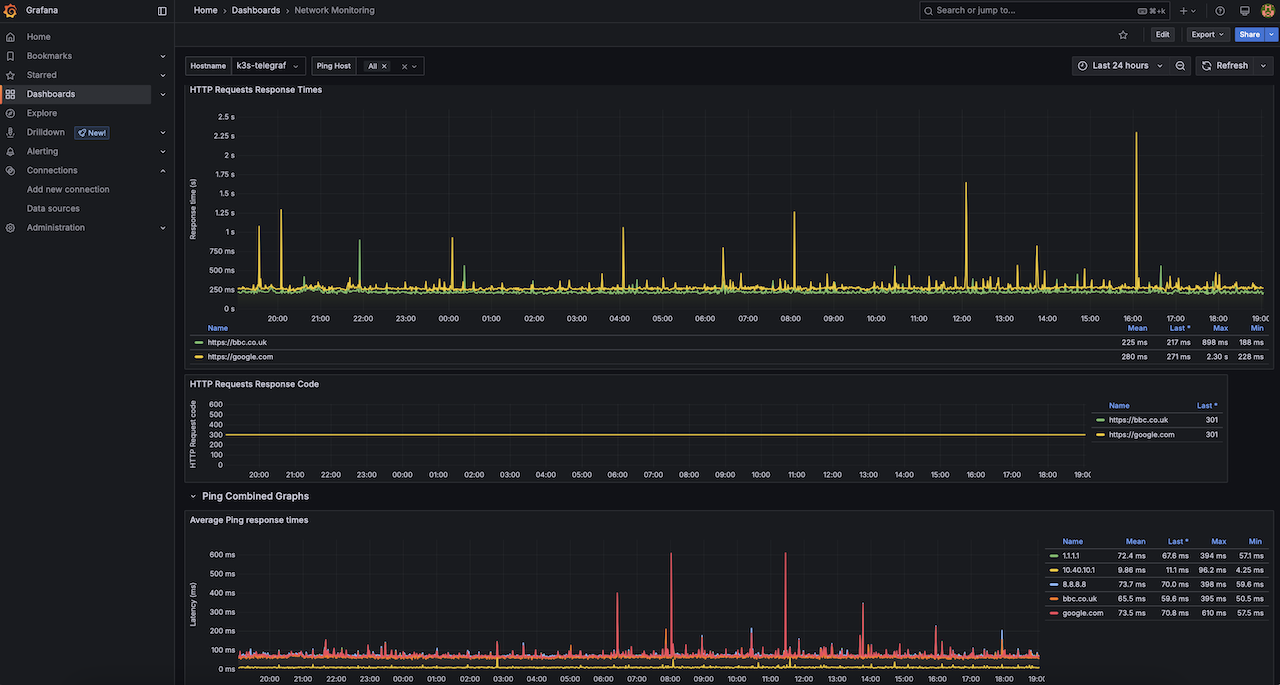
Can now log into Grafana GUI (http://k3s_node_ip:nodePort) with creds from the value file, under Connections > Data sources > influxdb click test to proved it is receiving measurement stats from influxdb. Import the Network monitoring dashboard and select influxdb as the data source.
Prometheus build
The prometheus helm chart deploys the following prometheus components as pods:
- Prometheus Server: The core component responsible for collecting, storing and presenting time-series data in a web user interface or dashboard (inbuilt Web UI or 3rd party like Grafana). The server periodically scrapes metrics from targets and converts those metrics into time series data which can be retrieved and manipulated for analysis and visualization using the Prometheus Query Language (PromQL)
- Alertmanager: Used to define rules based on metrics and trigger alerts to different communication channels based on specific conditions
- Pushgateway: To push time series data to the Prometheus targets as well as handling metrics for short-lived jobs. A Push gateway is capable of capturing metrics from non-containerized services
- kube-state-metrics: Listens to the Kubernetes API server to generate and expose cluster-level metrics. It is not focused on the health of the individual Kubernetes components, but rather on the health of the various objects inside (such as deployments, nodes and pods)
- node exporter: An exporter designed to export system metrics to prometheus’s pushgateway. Exporters are agents that expose metrics from various systems in a format prometheus can understand acting as connectors between prometheus and different system components
By default prometheus monitors many aspects of Kubernetes using kubernetes-apiservers, kubernetes-nodes and kubernetes-nodes-cadvisor to scrape the metrics. Pod and service monitoring (kubernetes-pods and kubernetes-service-endpoints) must be manually enabled which is why the following configurations were added to the TIG stack helm value files which I deployed earlier.
podAnnotations:
  prometheus.io/scrape: "true"
  prometheus.io/port: "xxx"            # match containerPort
service:
  annotations:
    prometheus.io/scrape: "true"
    prometheus.io/port: "xxx"          # match targetPort (container)
In the values file the scrap and evaluation intervals are lowered from 60 to 30 seconds and hostRootFsMount disabled to fix a node exporter issue.
global:
  evaluation_interval: 30s
  scrape_interval: 30s
  scrape_timeout: 10s
prometheus-node-exporter:
  hostRootFsMount:
    enabled: false
Add the helm chart repo, deploy the application (optional dry-run first) and then add a NodePort service to allow for remote access to the GUI.
helm repo add prometheus-community https://prometheus-community.github.io/helm-charts
helm repo update

helm install prom prometheus-community/prometheus -f helm_values/prometheus_values.yaml -n monitoring --dry-run --debug
helm install prom prometheus-community/prometheus -f helm_values/prometheus_values.yaml -n monitoring
kubectl expose service prom-prometheus-server --type=NodePort --target-port=9090 --name=prom-prometheus-server-ext -n monitoring
Will take a few minutes for it all to be built due to the amount of pods and elements created.
boa-pos-kbs01:~$ kubectl get all -n monitoring | egrep 'prom|NAME'
NAME                                                READY   STATUS    RESTARTS      AGE
pod/prom-alertmanager-0                             1/1     Running   0             4m14s
pod/prom-kube-state-metrics-5b9dfc8568-j8klx        1/1     Running   0             4m14s
pod/prom-prometheus-node-exporter-ns29r             1/1     Running   0             4m14s
pod/prom-prometheus-pushgateway-5d65d4d494-kr48q    1/1     Running   0             4m14s
pod/prom-prometheus-server-68df999957-f92b4         2/2     Running   0             4m14s
pod/snmp-prometheus-snmp-exporter-758fd5db6-bt4d6   1/1     Running   0             5d22h

NAME                                        TYPE        CLUSTER-IP      EXTERNAL-IP   PORT(S)              AGE
service/prom-alertmanager                   ClusterIP   10.43.95.203    <none>        9093/TCP             4m14s
service/prom-alertmanager-headless          ClusterIP   None            <none>        9093/TCP             4m14s
service/prom-kube-state-metrics             ClusterIP   10.43.160.246   <none>        8080/TCP             4m14s
service/prom-prometheus-node-exporter       ClusterIP   10.43.77.142    <none>        9100/TCP             4m14s
service/prom-prometheus-pushgateway         ClusterIP   10.43.177.58    <none>        9091/TCP             4m14s
service/prom-prometheus-server              ClusterIP   10.43.202.232   <none>        80/TCP               4m14s
service/prom-prometheus-server-ext          NodePort    10.43.255.1     <none>        80:31039/TCP         4m10s

NAME                                           DESIRED   CURRENT   READY   UP-TO-DATE   AVAILABLE   NODE SELECTOR            AGE
daemonset.apps/prom-prometheus-node-exporter   1         1         1       1            1           kubernetes.io/os=linux   4m14s

NAME                                            READY   UP-TO-DATE   AVAILABLE   AGE
deployment.apps/prom-kube-state-metrics         1/1     1            1           4m14s
deployment.apps/prom-prometheus-pushgateway     1/1     1            1           4m14s
deployment.apps/prom-prometheus-server          1/1     1            0           4m14s

NAME                                                      DESIRED   CURRENT   READY   AGE
replicaset.apps/prom-kube-state-metrics-5b9dfc8568        1         1         1       4m14s
replicaset.apps/prom-prometheus-pushgateway-5d65d4d494    1         1         1       4m14s
replicaset.apps/prom-prometheus-server-68df999957         1         1         0       4m14s

NAME                                 READY   AGE
statefulset.apps/prom-alertmanager   1/1     4m14s
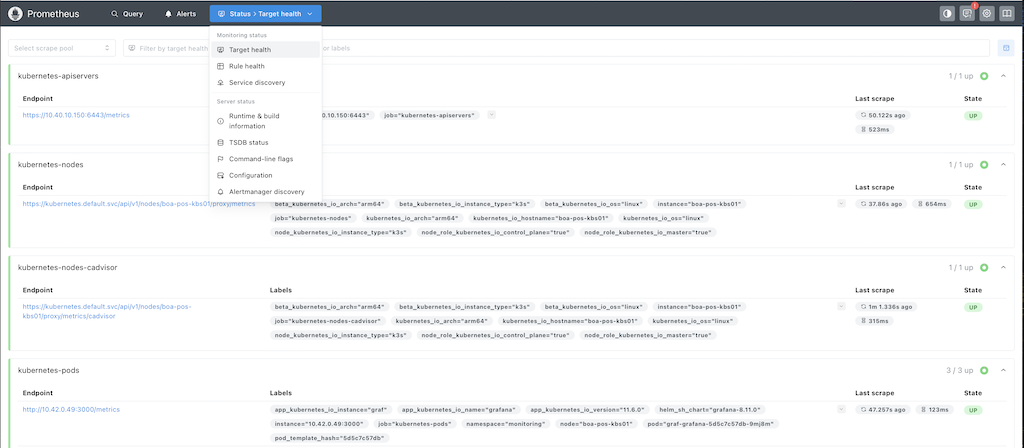
Can now get to the prometheus using http://k3s_node_ip:nodePort (don’t need any username or password), go to status » Target Health and make sure that all the metric sources that prometheus is scraping are green (will only be node-exporter and kubernetes stuff).
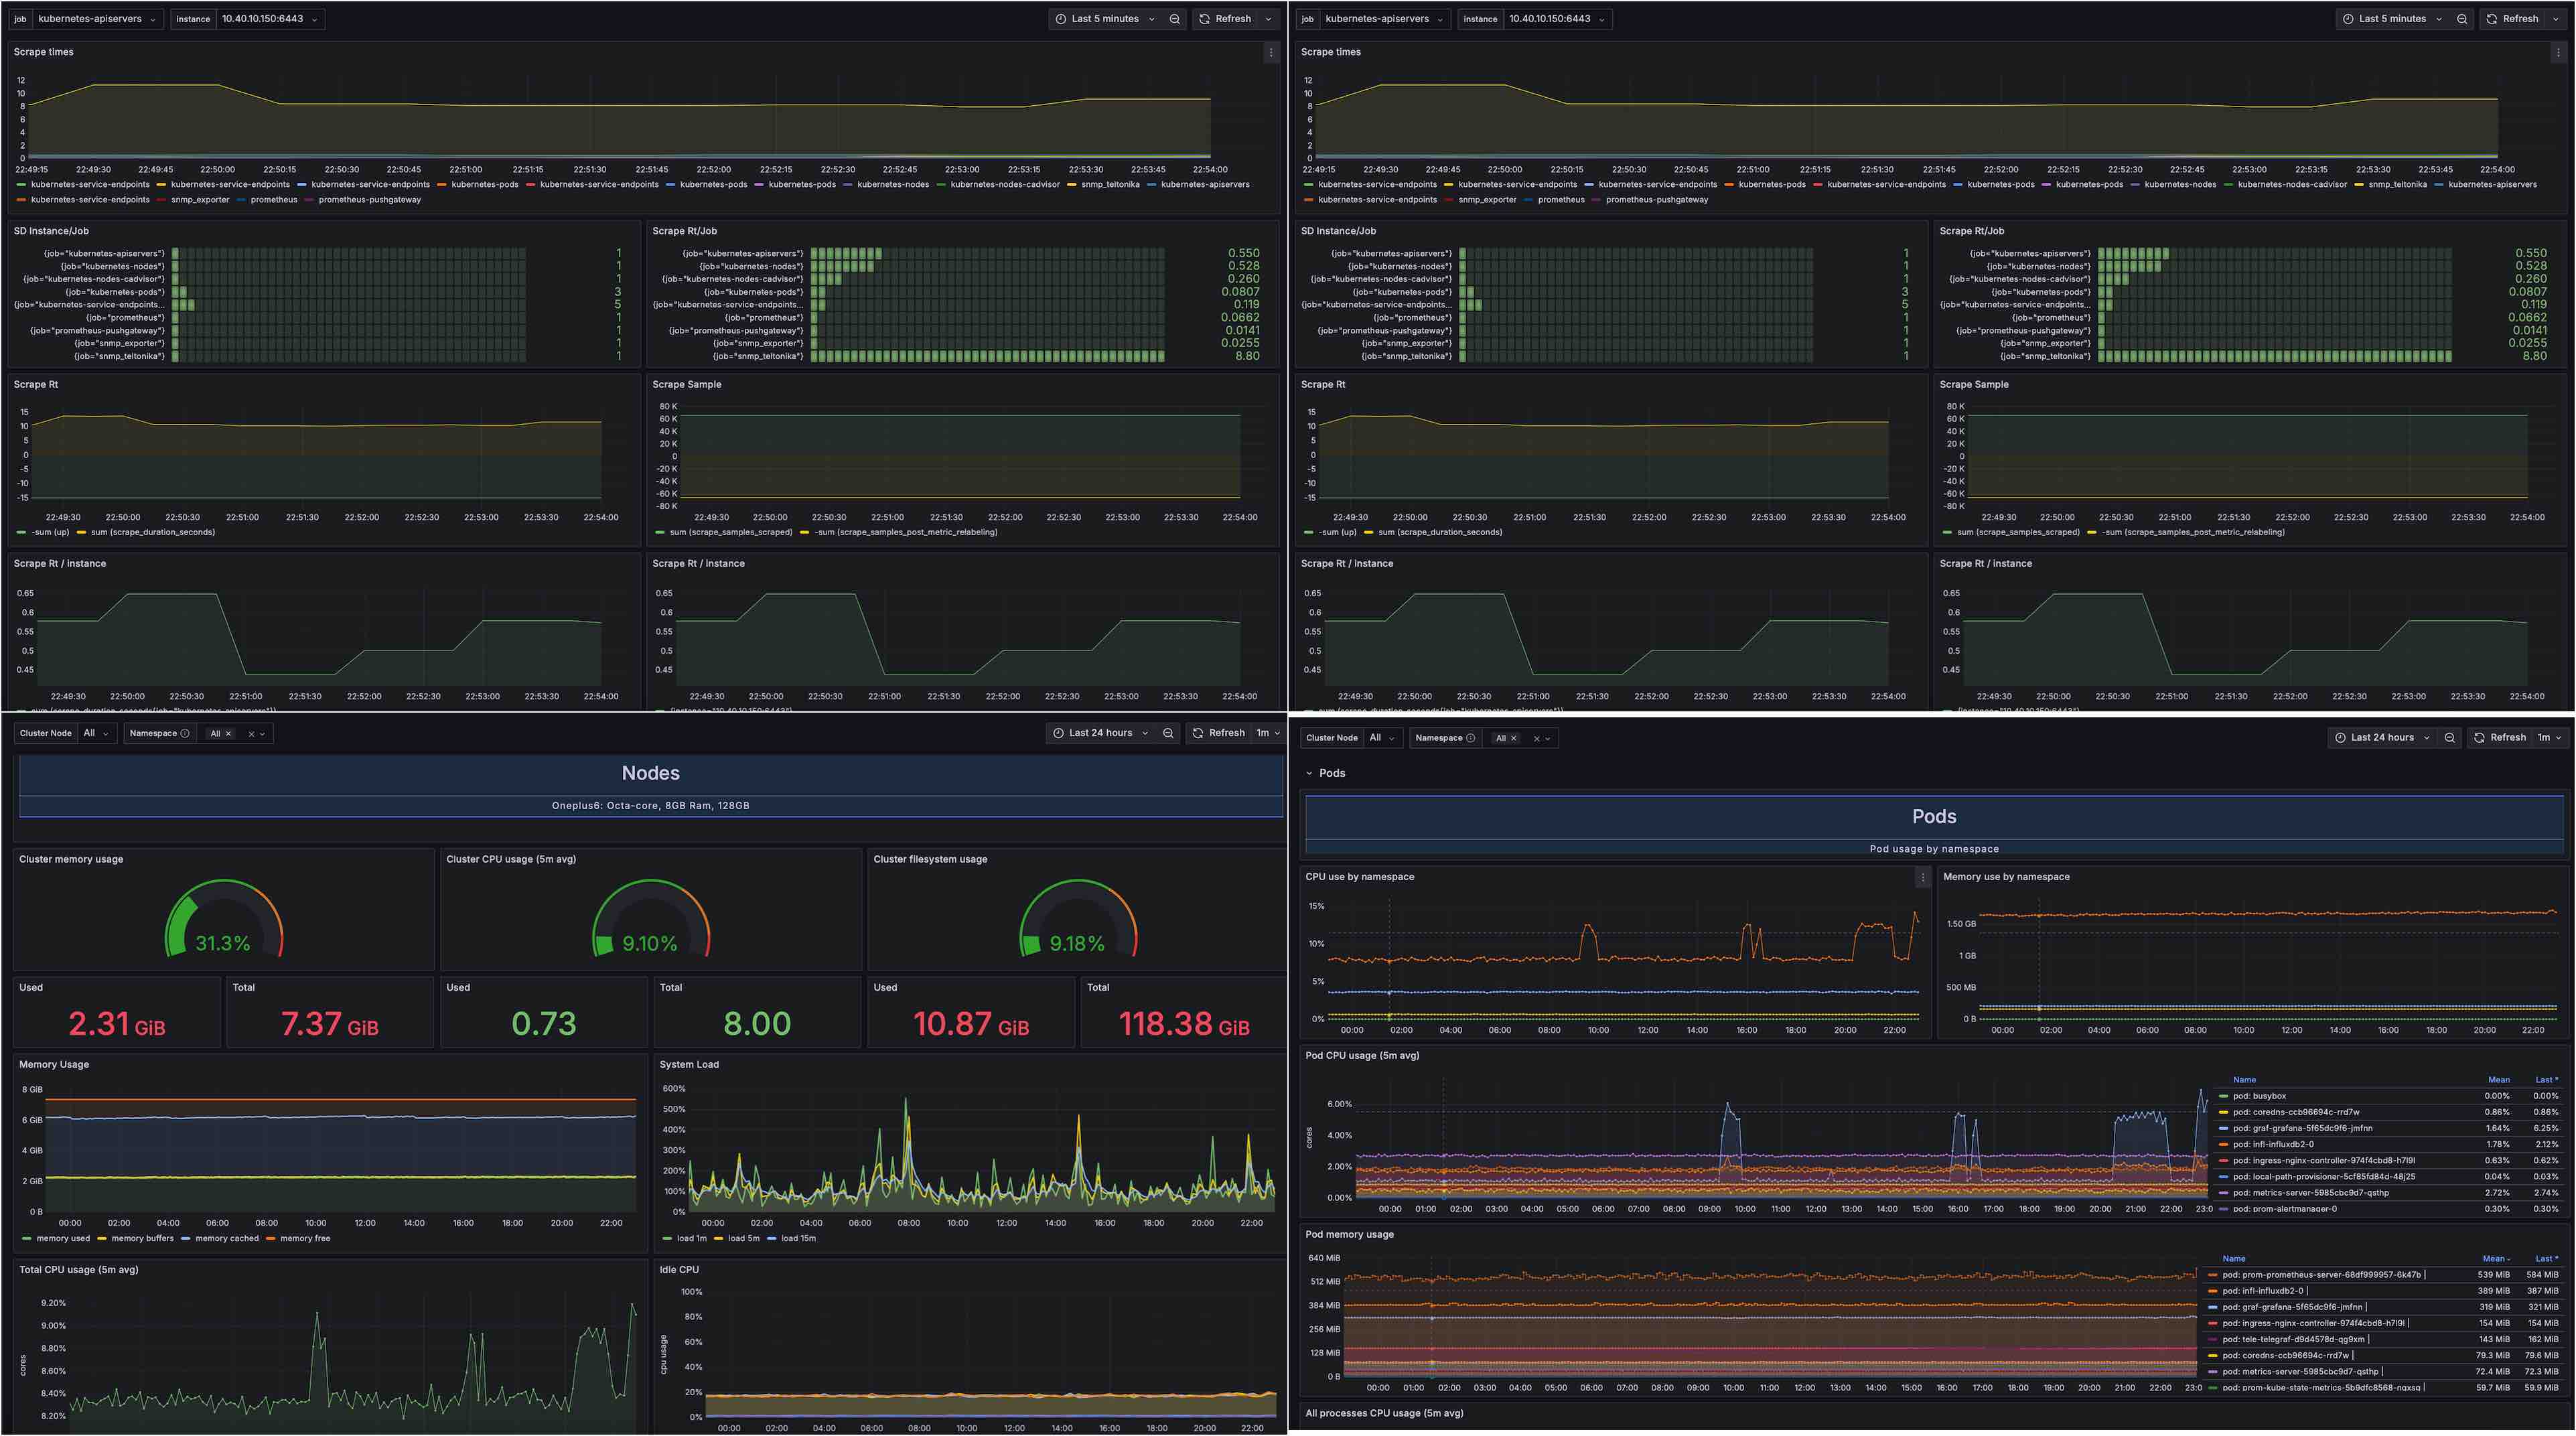
None of the pre-defined Grafana dashboards worked properly for all the metrics I was wanting to monitor so I ended up combinign bits from multiple dashboards. Import the Prometheus Scraping, Server (oneplus phone) Monitoring and K3s Node and Monitoring dashboards, all the data sources should be set to prometheus.
SNMP Exporter
The prometheus snmp-exporter is the recommended way to expose SNMP data in a format which prometheus can ingest. SNMP uses a hierarchical data structure whereas prometheus uses an n-dimensional matrix, it is the job of the snmp-exporter to map the SNMP index instances to labels to allow the exposed information collected by SNMP to be used by the prometheus monitoring system.
There are 2 elements to the solution, don’t confuse them as they are run separately for different purposes:
- snmp-exporter generator: This tool is run once to generate the snmp.yml file that contains all the information that the snmp-exporter needs. If you’re not using the ready-made vendor configurations shipped with the snmp-exporter (Teltonika isn’t one of them) then you need to feed the devices MIBs into the generator which uses NetSNMP to parse them and generate the mappings
- snmp-exporter: A container (pod) that performs the SNMP walk against the end device (Teltonika router) and posts the results for prometheus to scrape (is basically an SNMP to HTTP proxy)
Teltonika RUT950 SNMP configuration
SNMP is enabled under Services » SNMP, you may first need to install the SNMP package (System » Package Manager).
- SNMP Settings: Toggle ‘enable SNMP service’, add location, name and download the MIBs file (required by snmp-exporter generator)
- Communities: Change the public read-only community to whatever you will be using
Can test on a mac using snmpwalk -v 2c -c mycommunity -On 10.40.10.1 or with the solarwinds tool if you prefer a GUI.
snmp-exporter generator
Uses generator.yml (simplified collection instructions) to build the snmp.yml configuration that will eventually be used by snmp-exporter to collect SNMP from my Teltonika router. I am running this tool on a Ubuntu VM, first clone the repo and take a backup of the original generator.yml file.
git clone https://github.com/prometheus/snmp_exporter.git
cd snmp_exporter/generator
cp generator.yml generator.yml.bak
Next install the dependencies, build the generator (downloads default MIBs for well know vendors) and transfer over the Teltonika RUT950 MIB file that was downloaded earlier (the actual file name is not really important).
sudo apt-get install unzip build-essential libsnmp-dev golang-go
make generator mibs
scp user@10.40.20.167:~/downloads/BOA-RUT-WAP01.mib mibs/TELTONIKA.mib
The generator.yml file is made up of 2 sections:
- auths: Sets the SNMP version as well as SNMPv2 communities and/ or SNMPv3 credentials
- modules: Modules are the settings for the different device types, so how it creates the mappings from the devices SNMP MIBs
From the default MIBs I am only using if_mib, to keep the snmp.yml file to a minimal I removed everything else and added a new section for teltonika. Most of the teltonika details are from this blog, although I had to remove some of the lookups as they broke the generator.
---
auths:
  snmpv2_com:
    community: mycommunity
    version: 2
modules:
  if_mib:
    walk:
      - "IF-MIB::interfaces"
      - "IF-MIB::ifXTable"
    lookups:
      - source_indexes: [ifIndex]
        lookup: "IF-MIB::ifAlias"
      - source_indexes: [ifIndex]
        lookup: "IF-MIB::ifDescr"
      - source_indexes: [ifIndex]
        lookup: "IF-MIB::ifName"
    overrides:
      ifAlias:
        ignore: true
      ifDescr:
        ignore: true
      ifName:
        ignore: true
      ifType:
        type: EnumAsInfo
  teltonika:
    walk:
      - hrSystem
      - sysUpTime
      - ssCpuUser
      - ssCpuSystem
      - ssCpuIdle
      - 1.3.6.1.4.1.48690
      - 1.3.6.1.4.1.2021.4
      - 1.3.6.1.4.1.2021.10
      - 1.3.6.1.4.1.2021.11
      - hrStorage
    lookups:
      - source_indexes: [hrStorageIndex]
        lookup: hrStorageDescr
        drop_source_indexes: true
    overrides:
      mRSRQ:
        type: Float
      mSINR:
        type: Float
      mRSRP:
        type: Float
      mTemperature:
        type: Float
      ifAlias:
        ignore: true
      ifDescr:
        ignore: true
      ifName:
        ignore: true
      ifType:
        type: EnumAsInfo
Finally run the generator, the created the snmp.yml file will include:
- SNMP version / authentication
- OID subtrees to bulkget
- Matching of OID subtrees to prometheus label sets
$ MIBDIRS=./mibs ./generator generate
time=2025-04-16T21:55:46.289Z level=INFO source=net_snmp.go:174 msg="Loading MIBs" from=./mibs
time=2025-04-16T21:55:46.910Z level=INFO source=main.go:57 msg="Generating config for module" module=if_mib
time=2025-04-16T21:55:47.779Z level=INFO source=main.go:75 msg="Generated metrics" module=if_mib metrics=39
time=2025-04-16T21:55:47.779Z level=INFO source=main.go:57 msg="Generating config for module" module=teltonika
time=2025-04-16T21:55:47.872Z level=INFO source=main.go:75 msg="Generated metrics" module=teltonika metrics=204
time=2025-04-16T21:55:47.887Z level=INFO source=main.go:100 msg="Config written" file=/home/ste/snmp_exporter/generator/snmp.yml
snmp-exporter
The snmp-exporter helm chart was already downloaded as part of prometheus repo. Transfer the snmp.yml file over to the K3s node and pass it in as a helm install run-time value.
helm install snmp prometheus-community/prometheus-snmp-exporter --set-file config=helm_values/snmp.yml -n monitoring
kubectl expose service snmp-prometheus-snmp-exporter --type=NodePort --target-port=9116 --name=snmp-prometheus-snmp-exporter-ext -n monitoring

$ kubectl get all -n monitoring | grep snmp
pod/snmp-prometheus-snmp-exporter-758fd5db6-bt4d6        1/1     Running   0                3m50s
service/snmp-prometheus-snmp-exporter         ClusterIP   10.43.238.149   <none>        9116/TCP             3m51s
service/snmp-prometheus-snmp-exporter-ext     NodePort    10.43.119.54    <none>        9116:30684/TCP       51s
deployment.apps/snmp-prometheus-snmp-exporter       1/1     1            1           3m50s
replicaset.apps/snmp-prometheus-snmp-exporter-758fd5db6        1         1         1       3m50s
From the snmp-exporter GUI (http://k3s_node_ip:nodePort) can see the configuration passed in (config:) and the metrics of snmp-exporter itself (metrics:). SNMP collection can be tested using curl, this is the same cmd that prometheus-server will use to monitor it.
curl -i 'http://k3s_node_ip:nodePort/snmp?target=10.40.10.1&auth=snmpv2_com&module=if_mib'
curl -i 'http://k3s_node_ip:nodePort/snmp?target=10.40.10.1&auth=snmpv2_com&module=teltonika'
Update prometheus extraScrapeConfigs
extraScrapeConfigs is the main section of the prometheus-server configuration that specifies the targets for metric collection and how to collect it. Although defined as a string it is actually a list of jobs with each job specifying the configuration for collecting metrics from a specific resource or type of resources. The jobs defined are:
- snmp_teltonika: Need to specify the routers IP, authorization profile (from snmp.yaml) and replacement is the ClusterIP of the snmp-exporter pod. Had to increase the scrape times as SNMP from the router can be slow at times (may be worth reducing OIDs in snmp.yaml to speed up)
- snmp_exporter: Scrapes the health of the snmp-exporter itself, therefore the target is the ClusterIP of the snmp-exporter pod
extraScrapeConfigs: |
   - job_name: 'snmp_teltonika'
     scrape_interval: 40s
     scrape_timeout: 21s
     static_configs:
       - targets:
         - 10.40.10.1
     metrics_path: /snmp
     params:
       auth: [snmpv2_com]
       module: [if_mib, teltonika]
     relabel_configs:
       - source_labels: [__address__]
         target_label: __param_target
       - source_labels: [__param_target]
         target_label: instance
       - target_label: __address__
         replacement: snmp-prometheus-snmp-exporter.monitoring.svc.cluster.local:9116
   - job_name: 'snmp_exporter'
     static_configs:
       - targets: ['snmp-prometheus-snmp-exporter.monitoring.svc.cluster.local:9116']
This configuration is added to the bottom prometheus_values.yaml and the prometheus deployment upgraded to load the new configuration.
helm upgrade prom prometheus-community/prometheus -f helm_values/prometheus_values.yaml -n monitoring
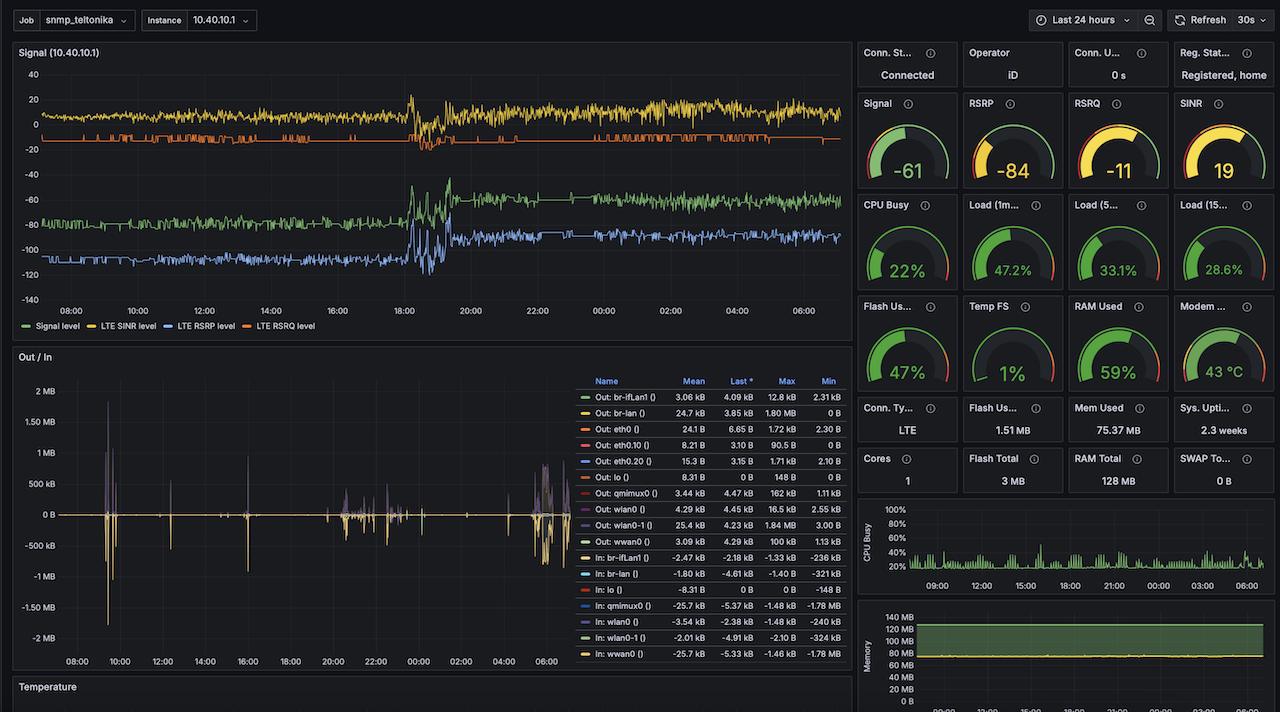
Should now see two extra scrapes in the prometheus target health matching the job names in extraScrapeConfigs (snmp_teltonika and snmp_exporter). Import the Teltonika Dashboard into grafana, will now have graphs for signal stength and throughput.
Victron Monitoring
The inverter/charger, solar controller, battery monitor and tank monitor are all connected to a Cerbo GX along with a couple of Ruuvi temperature sensors. MQTT (Message Queuing Telemetry Transport) can be used to pull all this data from the Cerbo GX and publish to other platforms, there a few ways to do this:
- Victron venus-influx-loader docker image designed specifically for this purpose, unfortunately it only supports influxDB v1
- Telegraf mqtt_consumer input plugin with the data sent to influxDB v2
- mqtt-exporter container with the data sent to Prometheus
I decided to go with the mqtt_consumer plugin as it is the path of least resistance, I already have Telegraf and InfluxDB v2 setup so it should just be a case of adding configuration to the Telegraf helm chart values file.
MQTT on Cerbo GX and keepalive script
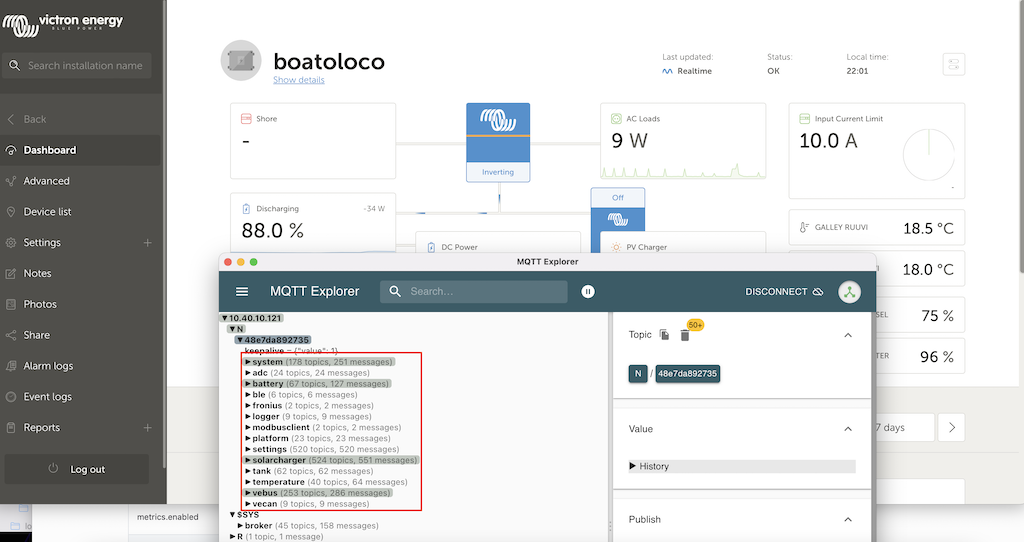
Enabling MQTT on Cerbo GX is pretty straightforward, under the services menu turn on MQTT on LAN (SSL) and MQTT on LAN (plaintext). This can be tested on a laptop using MQTT explorer, for this to work you need to have the VRM portal page open and displaying live data as the Cerbo GX won`t send MQTT updates if nobody is watching.
Obviously long term you cant have this only working when the portal is open, instead you can use a mosquitto-clients keepalive to replicate this. After installing (apk add mosquitto-clients) add a script (sudo nano /etc/periodic/daily/mqtt_keepalive.sh) to the daily directory (/etc/periodic/daily/) on the K3s node to have a cron job run the keepalive script each day.
#!/bin/sh
i=0
while [ "$i" -le 2880 ]
do
  /usr/bin/mosquitto_pub -h 10.40.10.121 -t 'R/48e7da892735/keepalive' -n
  i=$((i + 1))
  sleep 30
done
The script sends an empty MQTT “keepalive” message every 30 seconds and does this for 24 hours (2881 times) as the script is run once a day by cron. In the script change 10.40.10.121 and 48e7da892735 for your Cerbo GX IP and MQTT ID (is under N in the MQTT explorer data). Finally the script needs to be made executable and the crond service added to the boot sequence so it starts automatically at bootup.
sudo chmod +x /etc/periodic/daily/mqtt_keepalive.sh
sudo rc-update add crond
sudo rc-service crond start
rc-service crond status
Telegraf mqtt_consumer input
The mqtt_consumer input plugin configuration is added to the telegraf_values.yaml file, I got most of the config from this diysolarforum post. The mqtt_consumer servers is your cerbo GX IP, the topics (need the cerbo GX ID) are what you want to collect data from, and the hash (#) just means everything within that specific topic (can be more granular if you wish). mqtt_consumer.topic_parsing splits the topics and regex processors tidies up these topics so that the InfluxDB queries that the Grafana dashboard uses are categorised to make them simpler to define.
    - mqtt_consumer:
        servers: ["tcp://10.40.10.121:1883"]
        data_format: "json"
        topics:
          - "N/48e7da892735/system/#"
          - "N/48e7da892735/battery/#"
          - "N/48e7da892735/solarcharger/#"
          - "N/48e7da892735/tank/#"
          - "N/48e7da892735/temperature/#"
          - "N/48e7da892735/vebus/#"
    - mqtt_consumer.topic_parsing:
        topic: "N/48e7da892735/#"               # match on any "N" MQTT topicfrom my Cerbo ID
        measurement: "measurement/_"            # Set measurement var to to be N
        tags: "_/cerbo/path/VRMinstance"        # Set tags for next 3 elements (cerbo_id, catergory and instance)
  processors:
    - enum:
        mapping:
          field: "status"
          dest: "status_code"
          value_mappings:
            healthy: 1
            problem: 2
            critical: 3
    - regex:
        tags:
          key: "topic"
          pattern: "^N/[^/]+/[^/]+/[^/]+/(.+)$"
          replacement: "${1}"                   # Removes measurement/path/VRMinstance from the full topic path
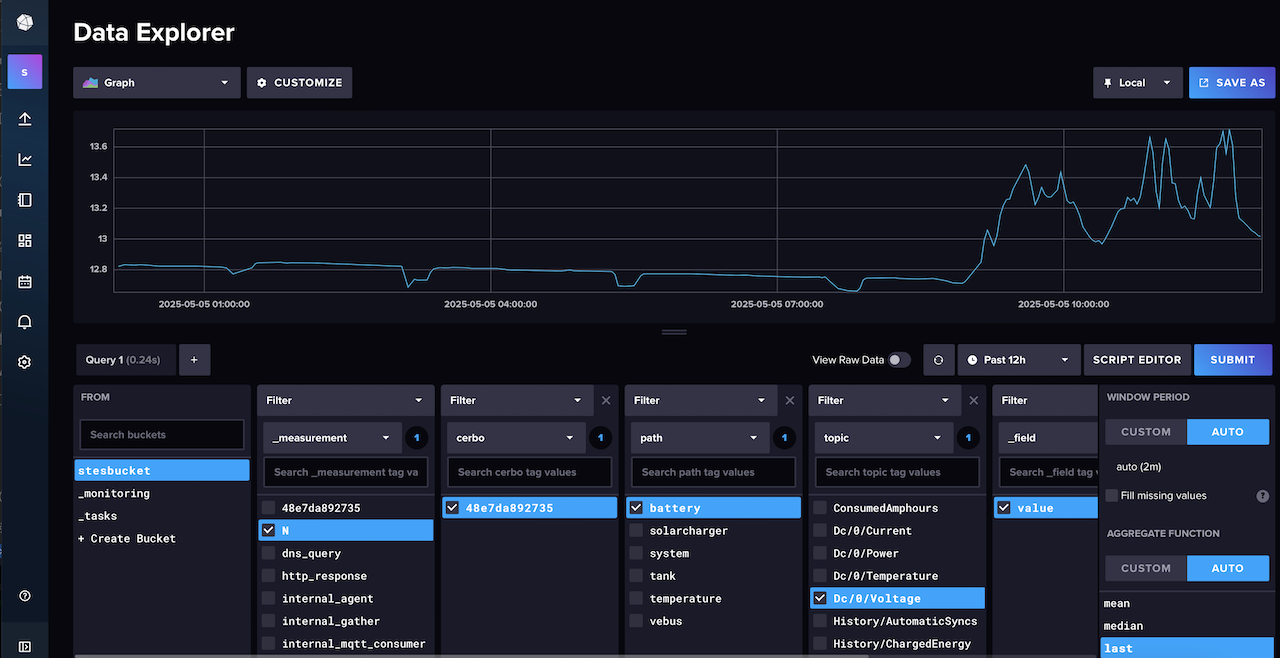
The above topic_parsing and regex splits the data into the following InfluxDB keys:
- measurement: The top of the tree in InfluxDB, this is N
- cerbo: The Cerbo GX ID, in my dashboards I make this a grafana variable so I can see data for different systems if I add more
- path: Categorises the monitored topics (battery, solarcharger, system, tank, temperature, vebus)
- VRMinstance: Is only used if have more than one element in the category, for example different tanks or ruuvi sensors
- topic: The different elements that can be monitored under each category
If you look in the influxDB data explorer you should now see the data from the Cerbo GX formatted in this structure.
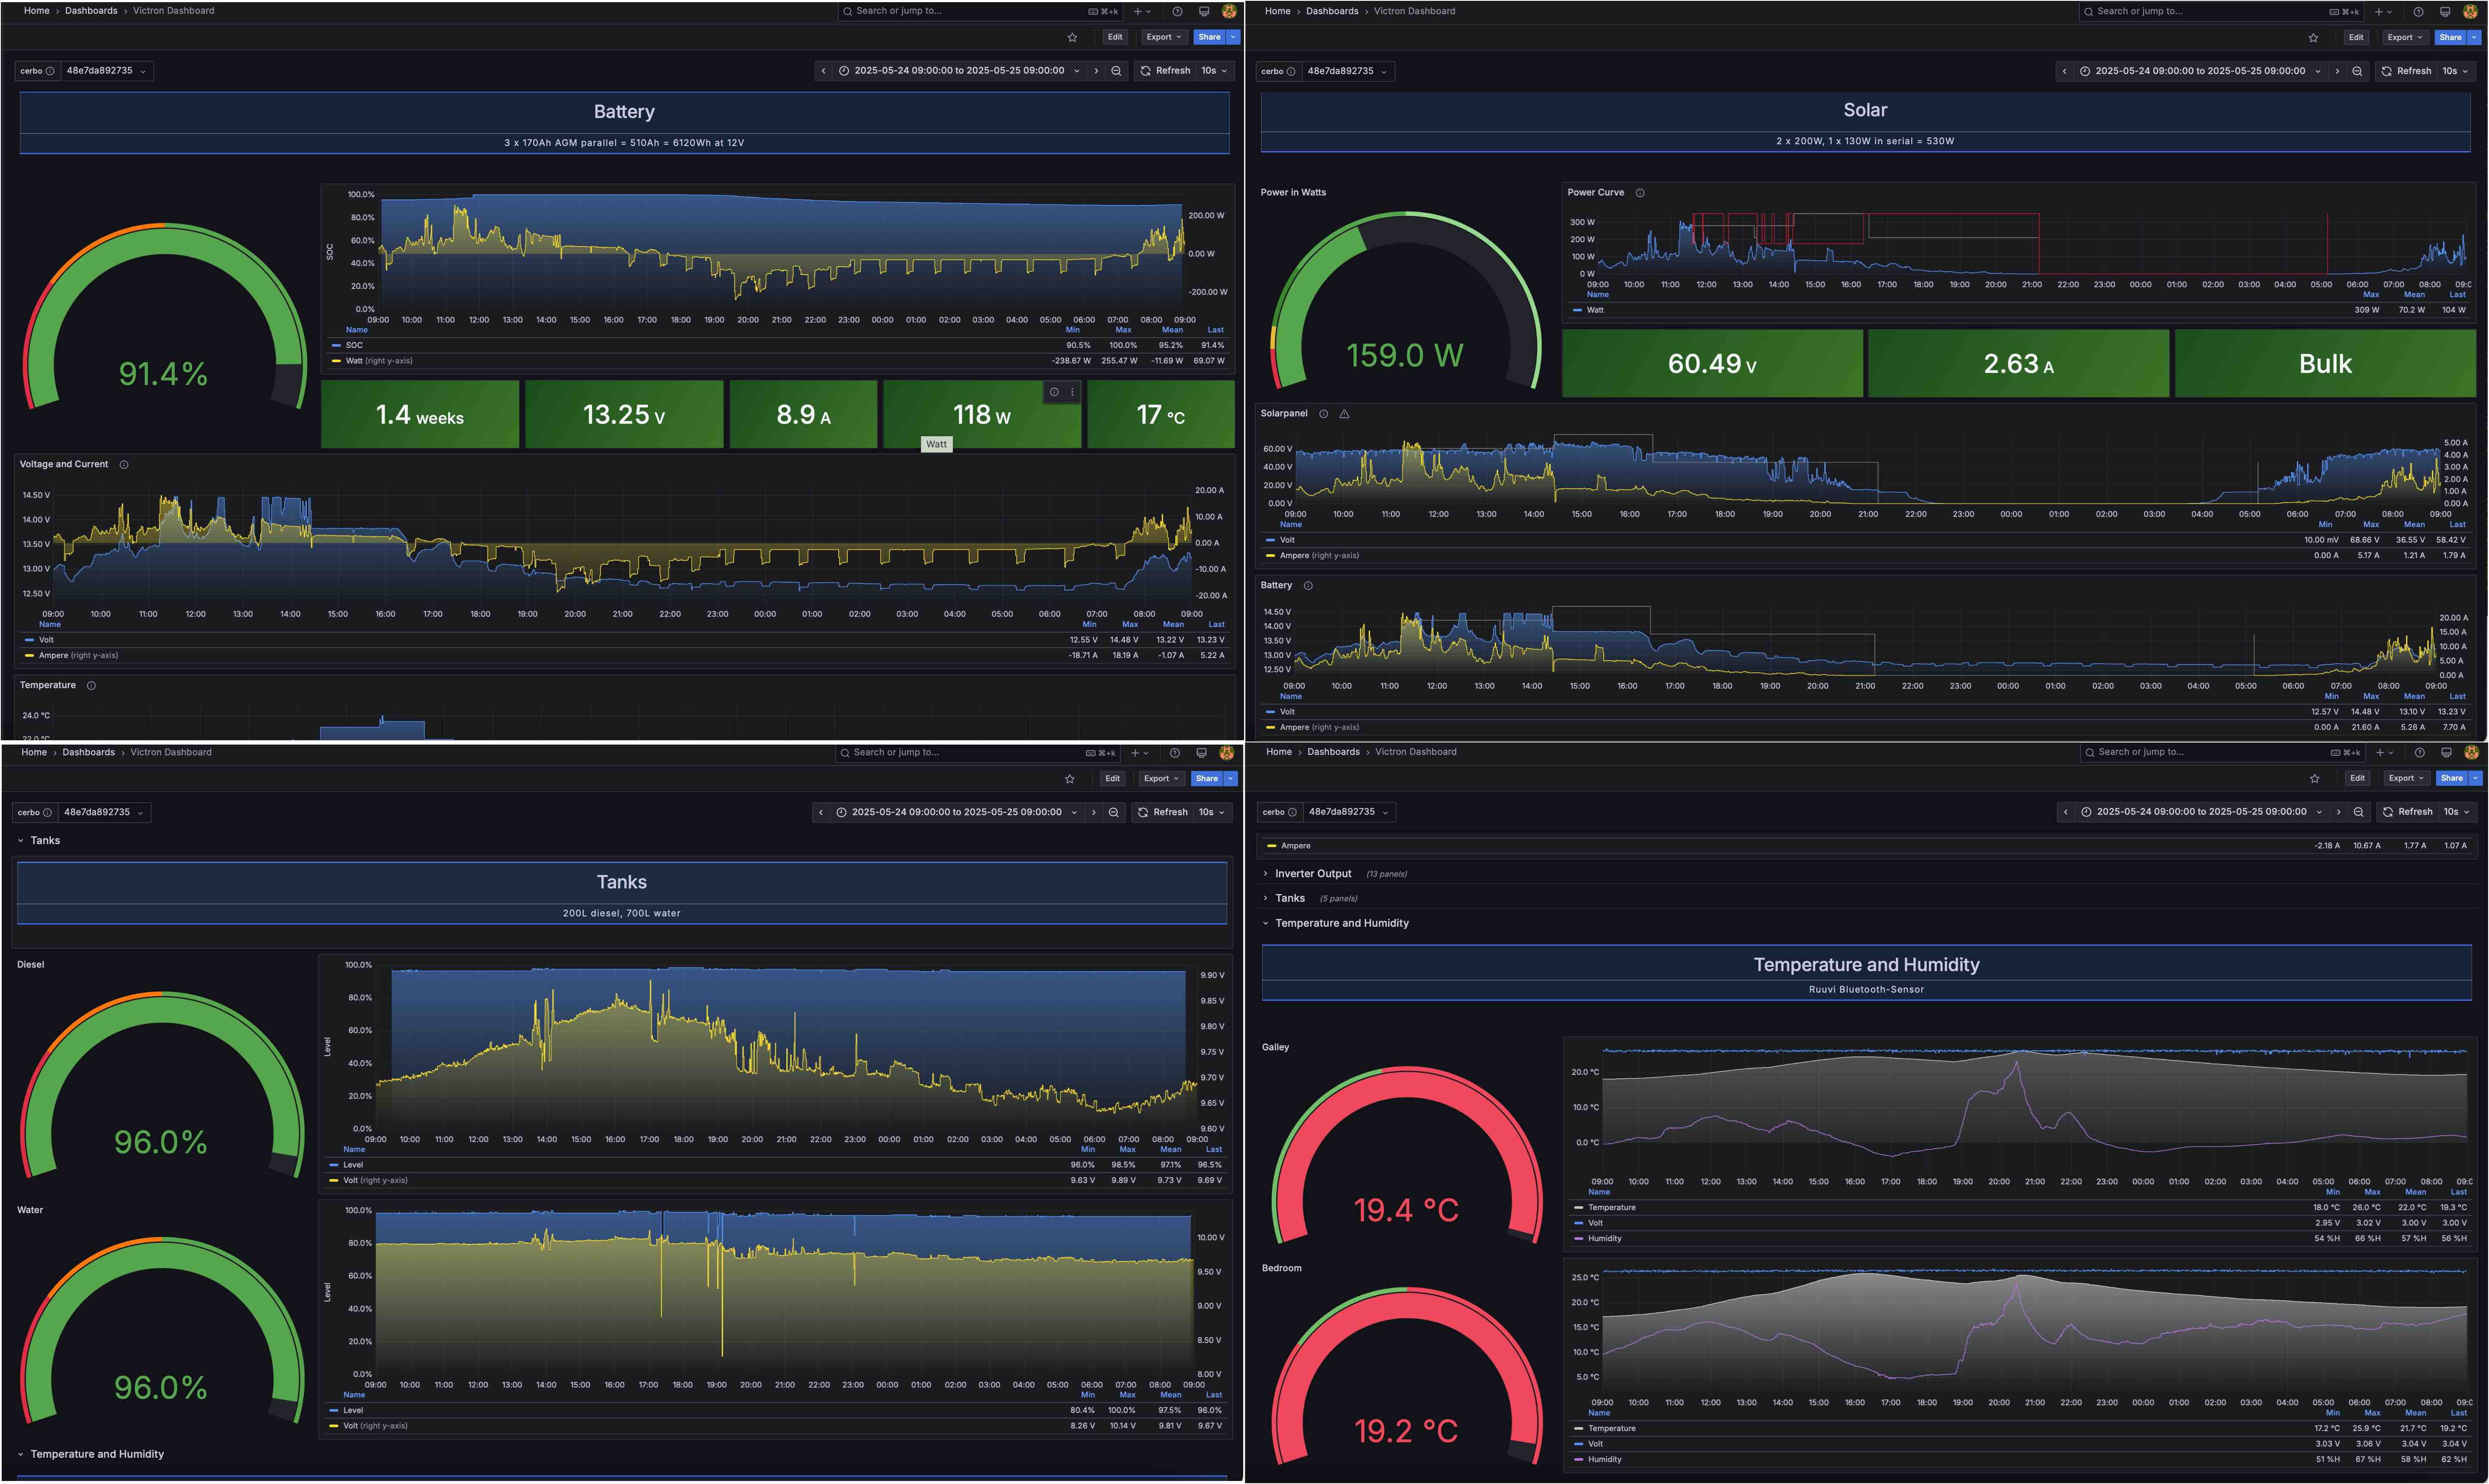
My Victron dashboard is based off the excellent banu-womo, I had to change all the queries to match my Telegraf topic parsing format and add a few other things such as tank monitoring. The AC power section is still a work in progress as I cant do that until connected to shore power when i next moor at a marina.
Summary
So there you have a it, a very comprehensive boat monitoring system run as Kubernetes pods off an old android phone. It took me a long while to get it all working as was the first time I have used Kubernetes, but now it is am pretty impressed with all the data I am getting from it. As it is deployed as Kubernetes pods it should be easy to replicate if I need to expand or build something similar.
To save having to go through this whole blog when deploying I have put together a quickstart guide with all the files and commands needed, after changing a few environment specific values you should be able to deploy on any K3s nodes using Helm charts. If I was to do this again I would probably take it one step further and look at using Argo CD to deploy everything in GitOps pattern using the Git repository as the source of truth.
I recently started a fully remote short-term contract which so decided to get Starlink mini as I cant risk using notoriously flakey 4G/5G for work. The mini version is designed for roaming so is powered off DC (can use battery banks if you want) and only draws about 22W. There is a prometheus starlink-exporter for monitoring this so will probably look at also adding that to my monitoring solution at some point.
Reference
- This is the guide I follows for installing Kubernetes on an android phone
- Some useful info on setting up Telegraf, InfluxDB & Grafana in Kubernetes
- Telegraf input plugins collect metrics from the system, services, or third-party APIs and output plugins write metrics to destinations
- The Grafana offical guide for deploying using helm charts
- Monitoring Linux host metrics using node-exporter
- Monitoring Teltonika with prometheus snmp-exporter and grafana. Not the best guide but useful dashoard, this is a lot better on the snmp-exporter elements and this grafana blog also has a bit of info on it
- Victron forum explaining that venus will not work with Influxdb1 at present time
- Good diysolarforum post on setting up telgraf mqqt-consumer plugin to gather data from Cerbo GX MQTT config from